Mastering the Head and Shoulders Chart Pattern
A Complete Guide for Traders to Spot Trend Reversals
📅 August 30, 2026
⏱️ 8 min read
📊 Technical Analysis
If you've spent any time studying technical analysis, you've likely come across the Head and Shoulders pattern—one of the most reliable and widely recognized reversal patterns in trading. Whether you're a beginner navigating your first charts or an intermediate trader refining your strategy, understanding this pattern can significantly improve your ability to spot trend reversals before they fully develop.
In this guide, we'll break down exactly what the Head and Shoulders pattern is, how to identify it, what it signals, and—most importantly—how to trade it effectively.
What Is the Head and Shoulders Pattern?
The Head and Shoulders pattern is a bearish reversal formation that appears at the top of an uptrend. It signals that the prevailing bullish momentum is weakening and that a potential trend reversal to the downside may be imminent.
Visually, the pattern resembles a human silhouette with three peaks:
- Left Shoulder: The first peak, formed during the ongoing uptrend.
- Head: The highest peak, representing the climax of bullish momentum.
- Right Shoulder: The third peak, lower than the head, indicating diminishing buying pressure.
These three peaks are connected by a neckline—a support level drawn across the lows of the two troughs between the peaks. When price breaks below this neckline with conviction, the pattern is confirmed, and traders typically enter short positions.
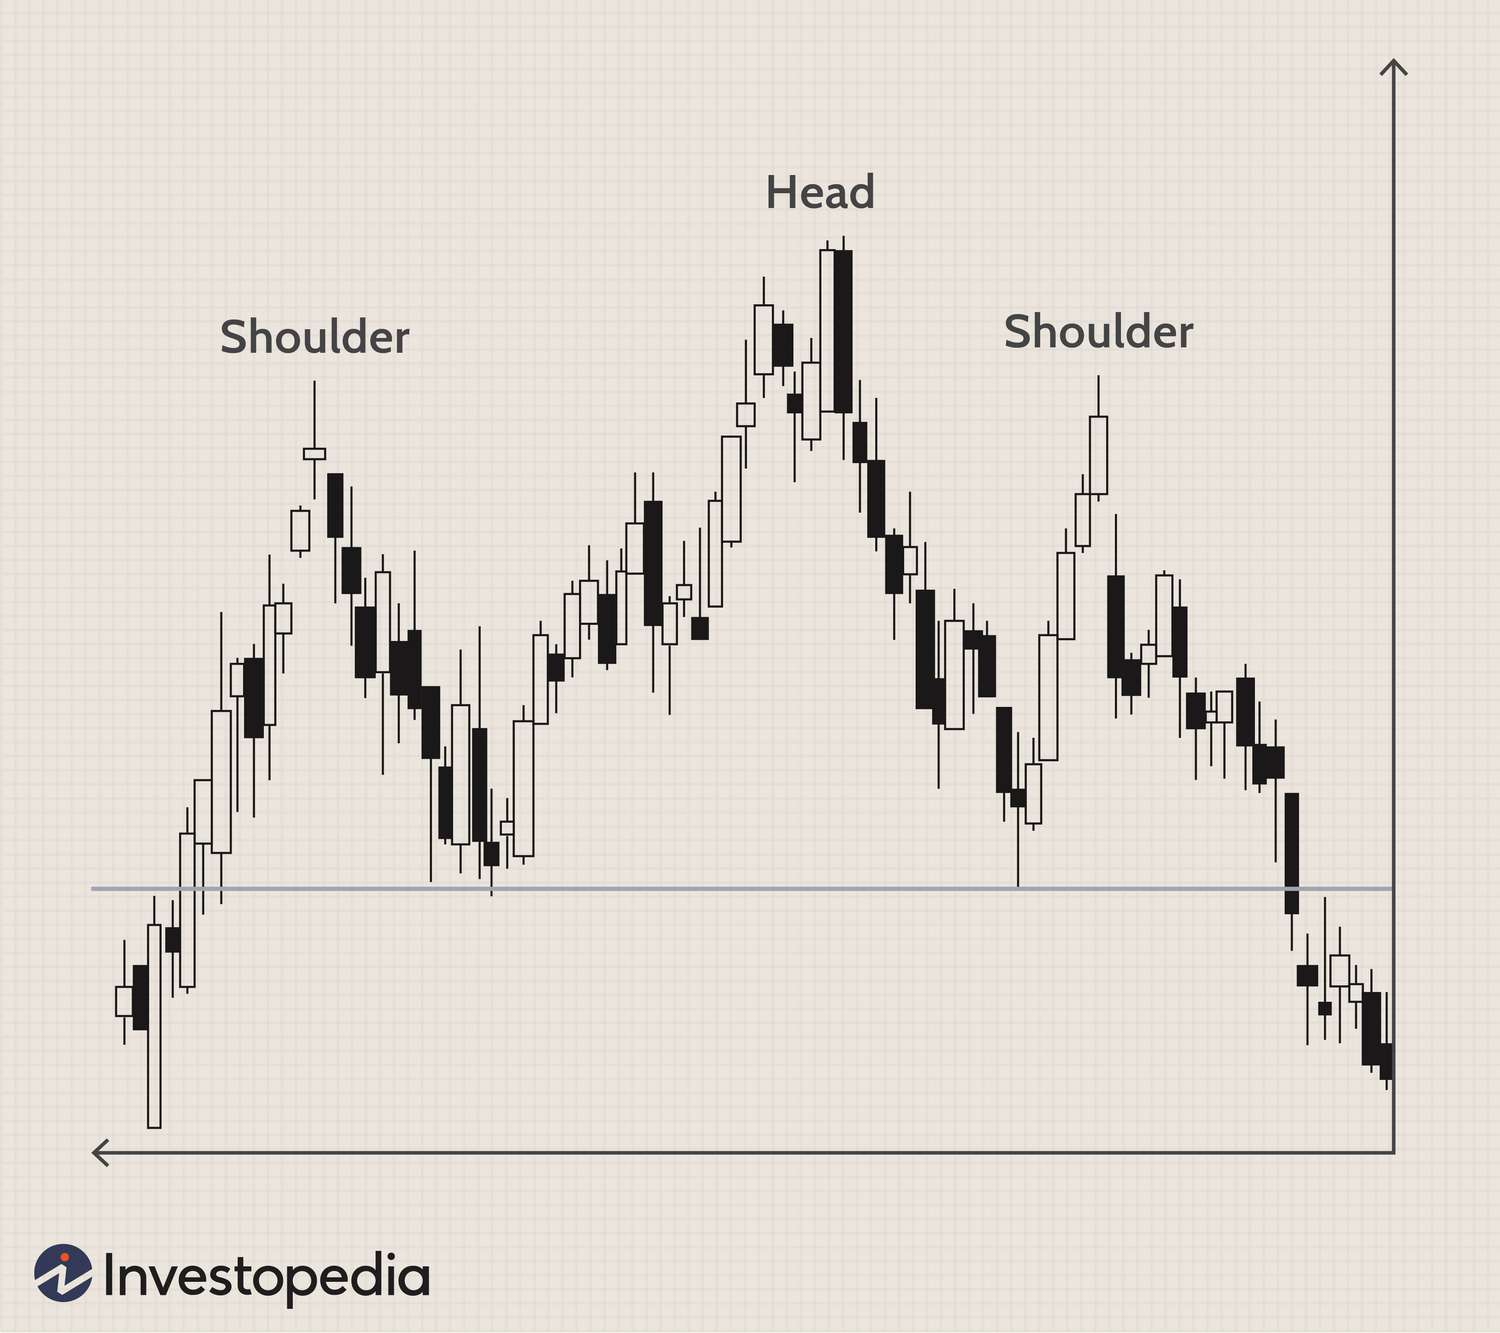
Classic Head and Shoulders Pattern Formation
Source: Investopedia
The Inverse Head and Shoulders: The Bullish Counterpart
Just as the standard Head and Shoulders signals a bearish reversal, the Inverse Head and Shoulders (or Head and Shoulders Bottom) signals a bullish reversal at the end of a downtrend.
In this variation:
- The pattern forms three troughs instead of peaks.
- The middle trough (the head) is the lowest point.
- The right shoulder is higher than the head, showing that selling pressure is exhausting.
- A breakout above the neckline confirms the bullish reversal.
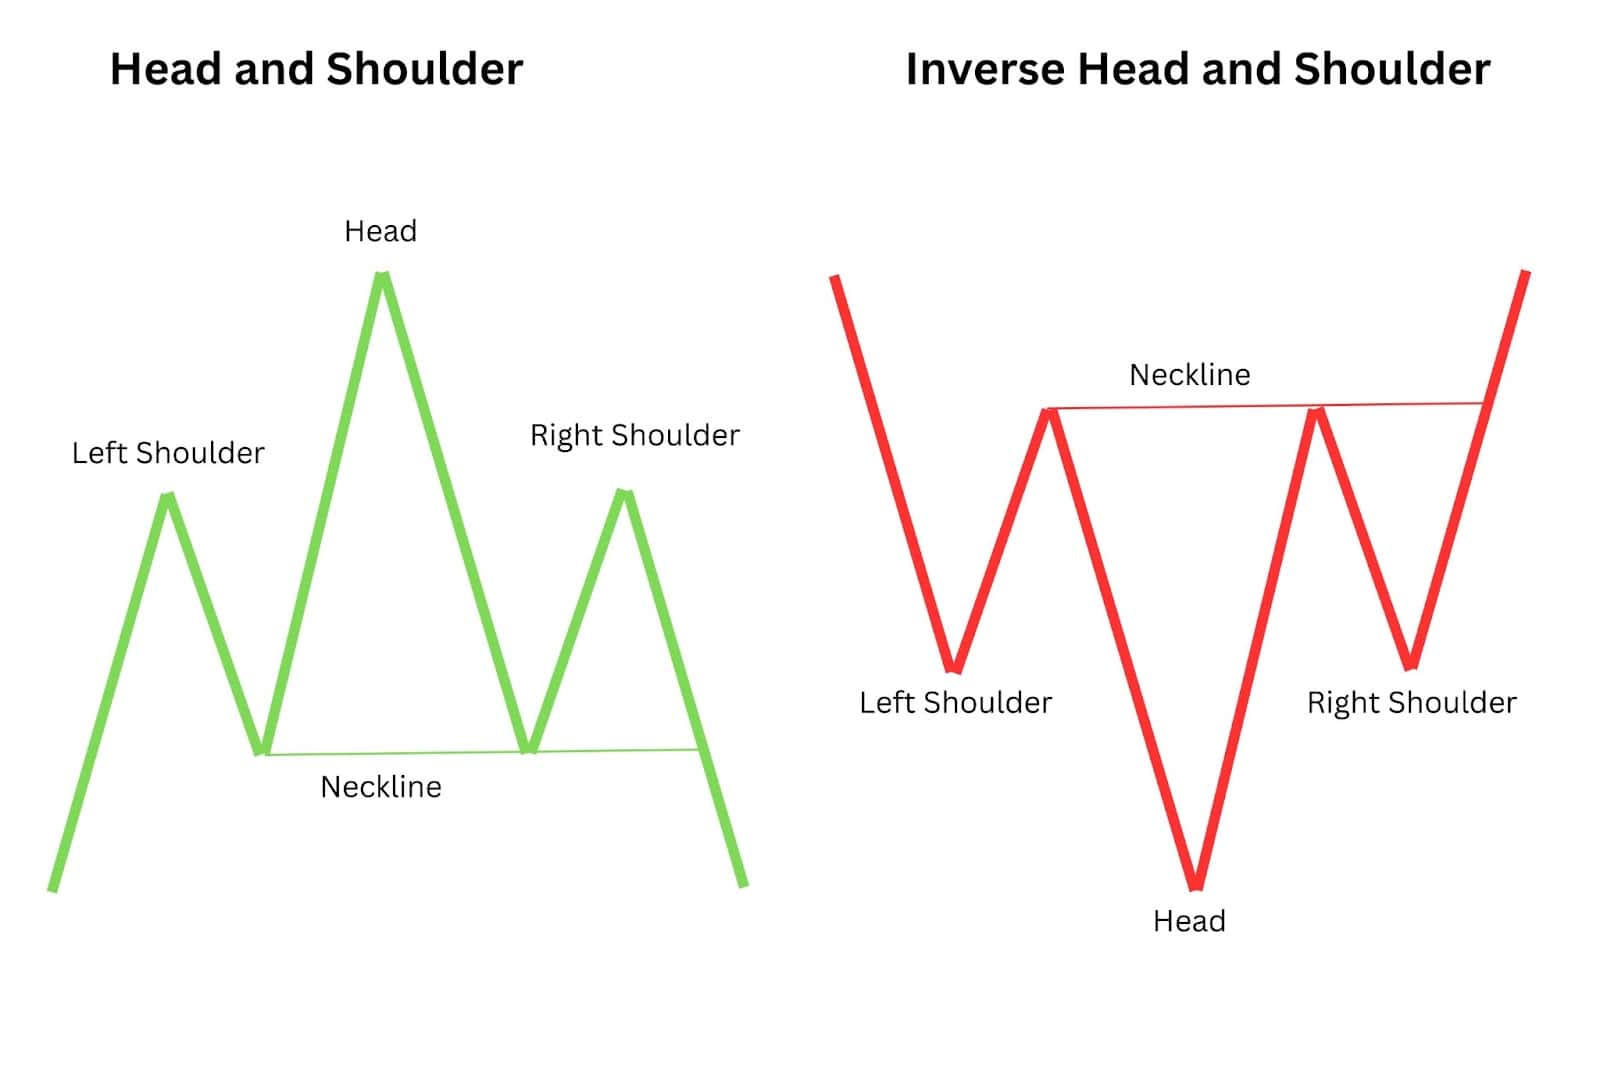
Head and Shoulders vs Inverse Head and Shoulders Pattern
Source: Alchemy Markets
This pattern is equally powerful and is favored by traders looking to catch the beginning of a new uptrend.
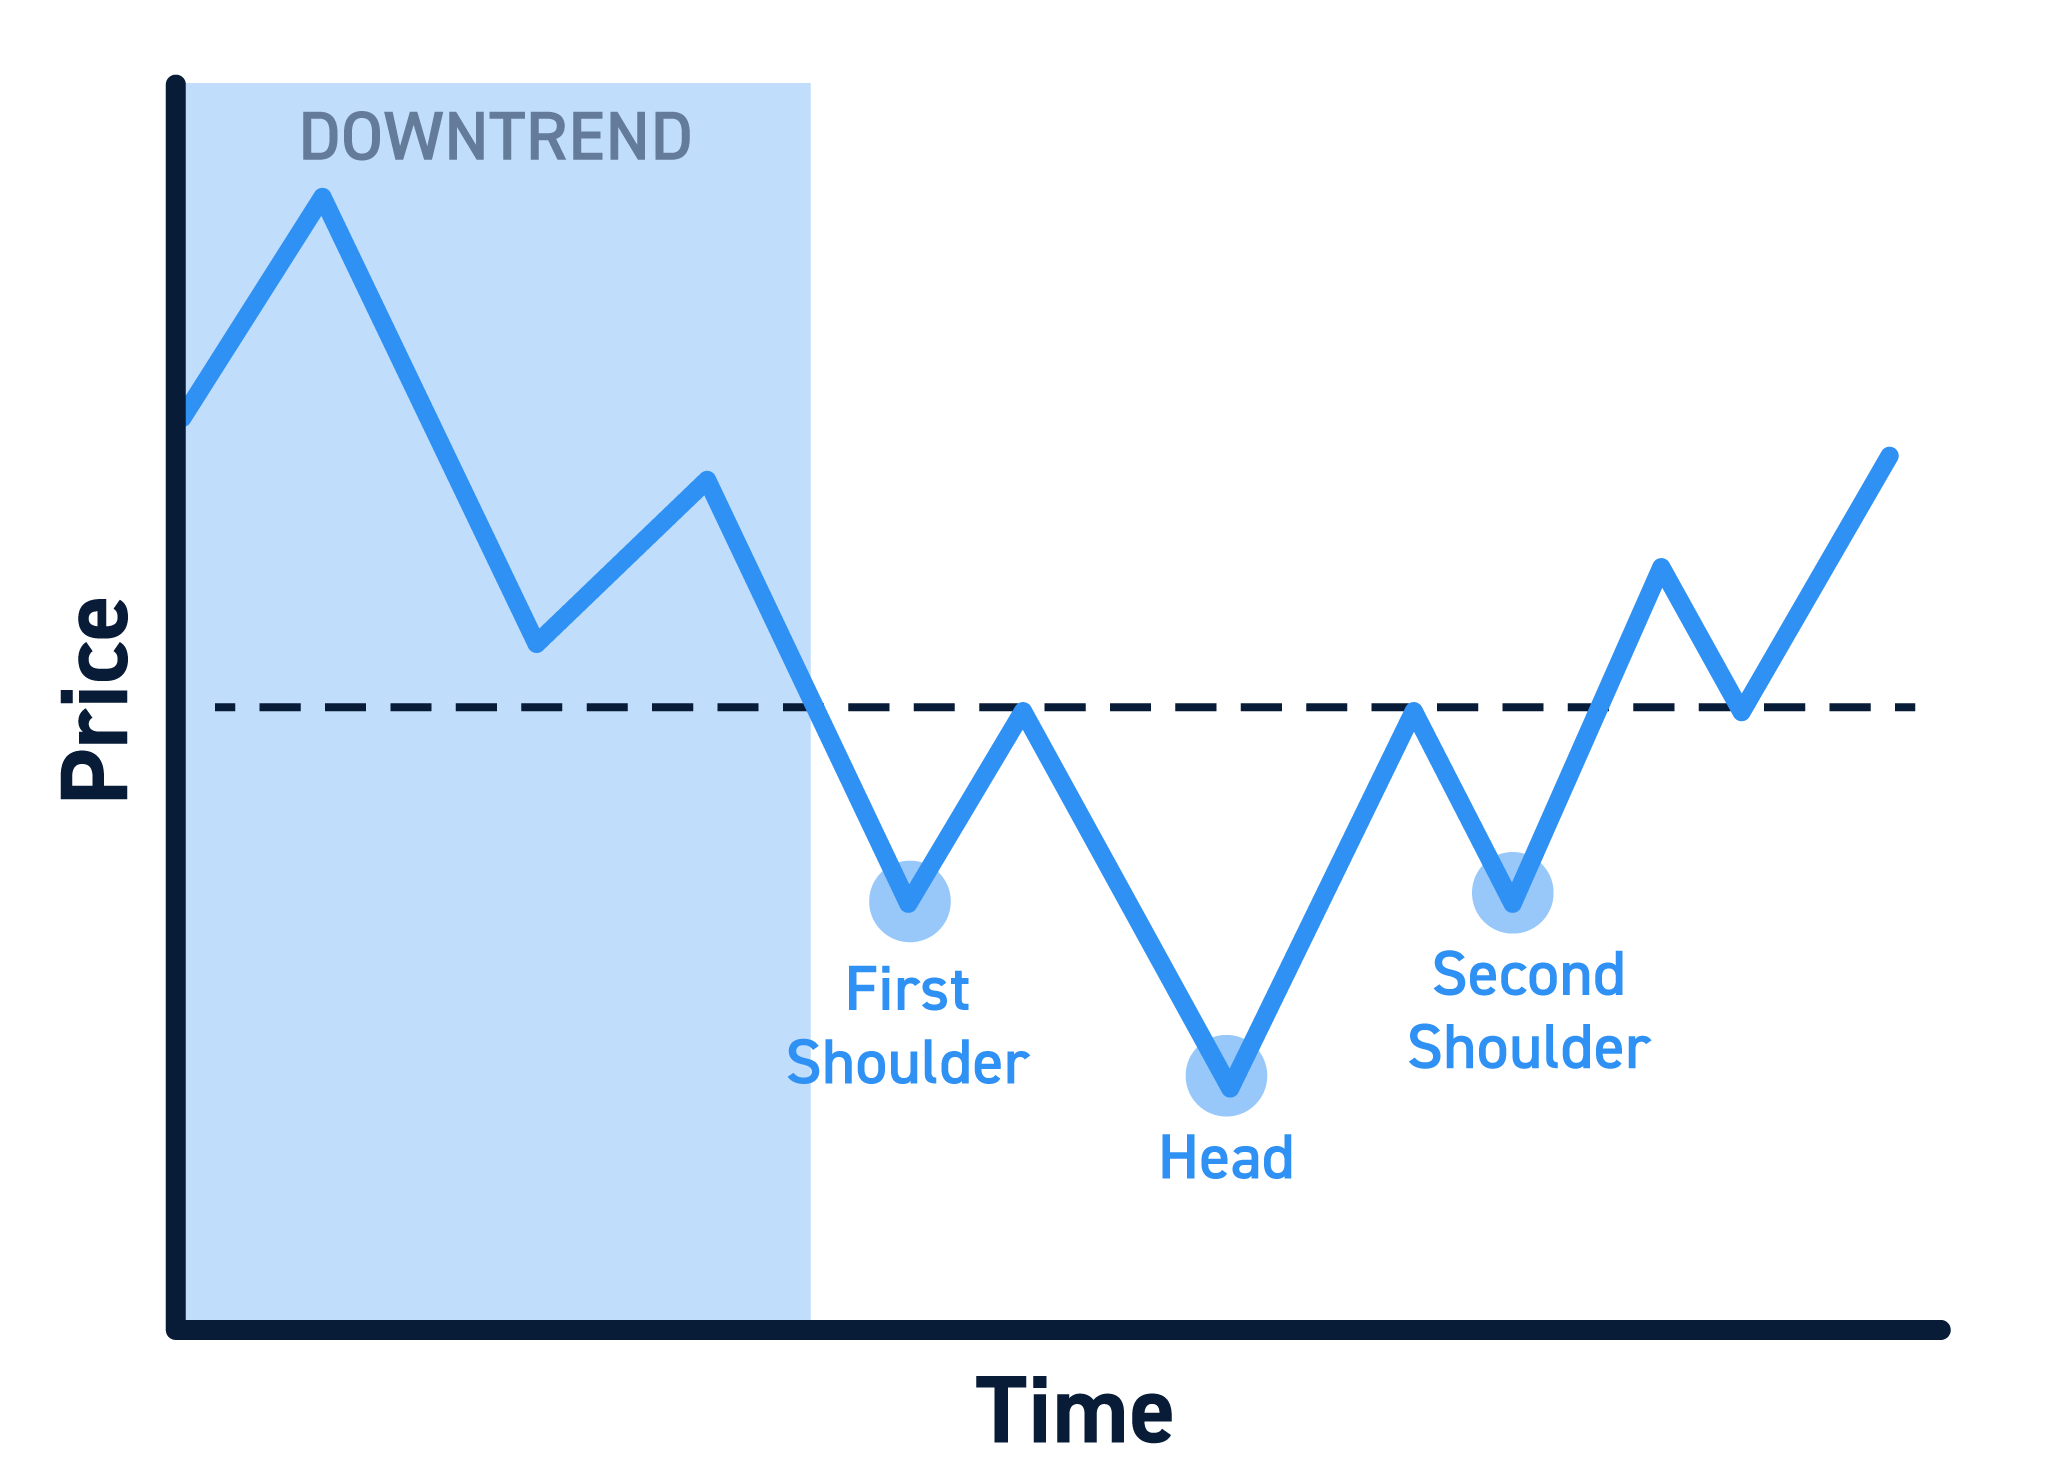
Inverse Head and Shoulders Pattern with Breakout
Source: CenterPoint Securities
How to Identify the Pattern Correctly
Spotting a genuine Head and Shoulders pattern requires more than just noticing three peaks on a chart. Here are the key characteristics to look for:
1. Prior Trend
The pattern must form after a sustained uptrend. A Head and Shoulders pattern that appears in the middle of a sideways market or during a downtrend lacks validity and should be treated with skepticism.
2. Symmetry Matters
While perfect symmetry isn't required, the left and right shoulders should be roughly similar in height and width. Dramatically asymmetrical shoulders may indicate a different pattern altogether.
3. Volume Confirmation
Volume plays a critical role in validating the pattern. Ideally:
- Volume should be highest during the formation of the left shoulder.
- Volume should decrease during the head formation.
- Volume should be even lower during the right shoulder.
- Volume should spike when price breaks below the neckline.
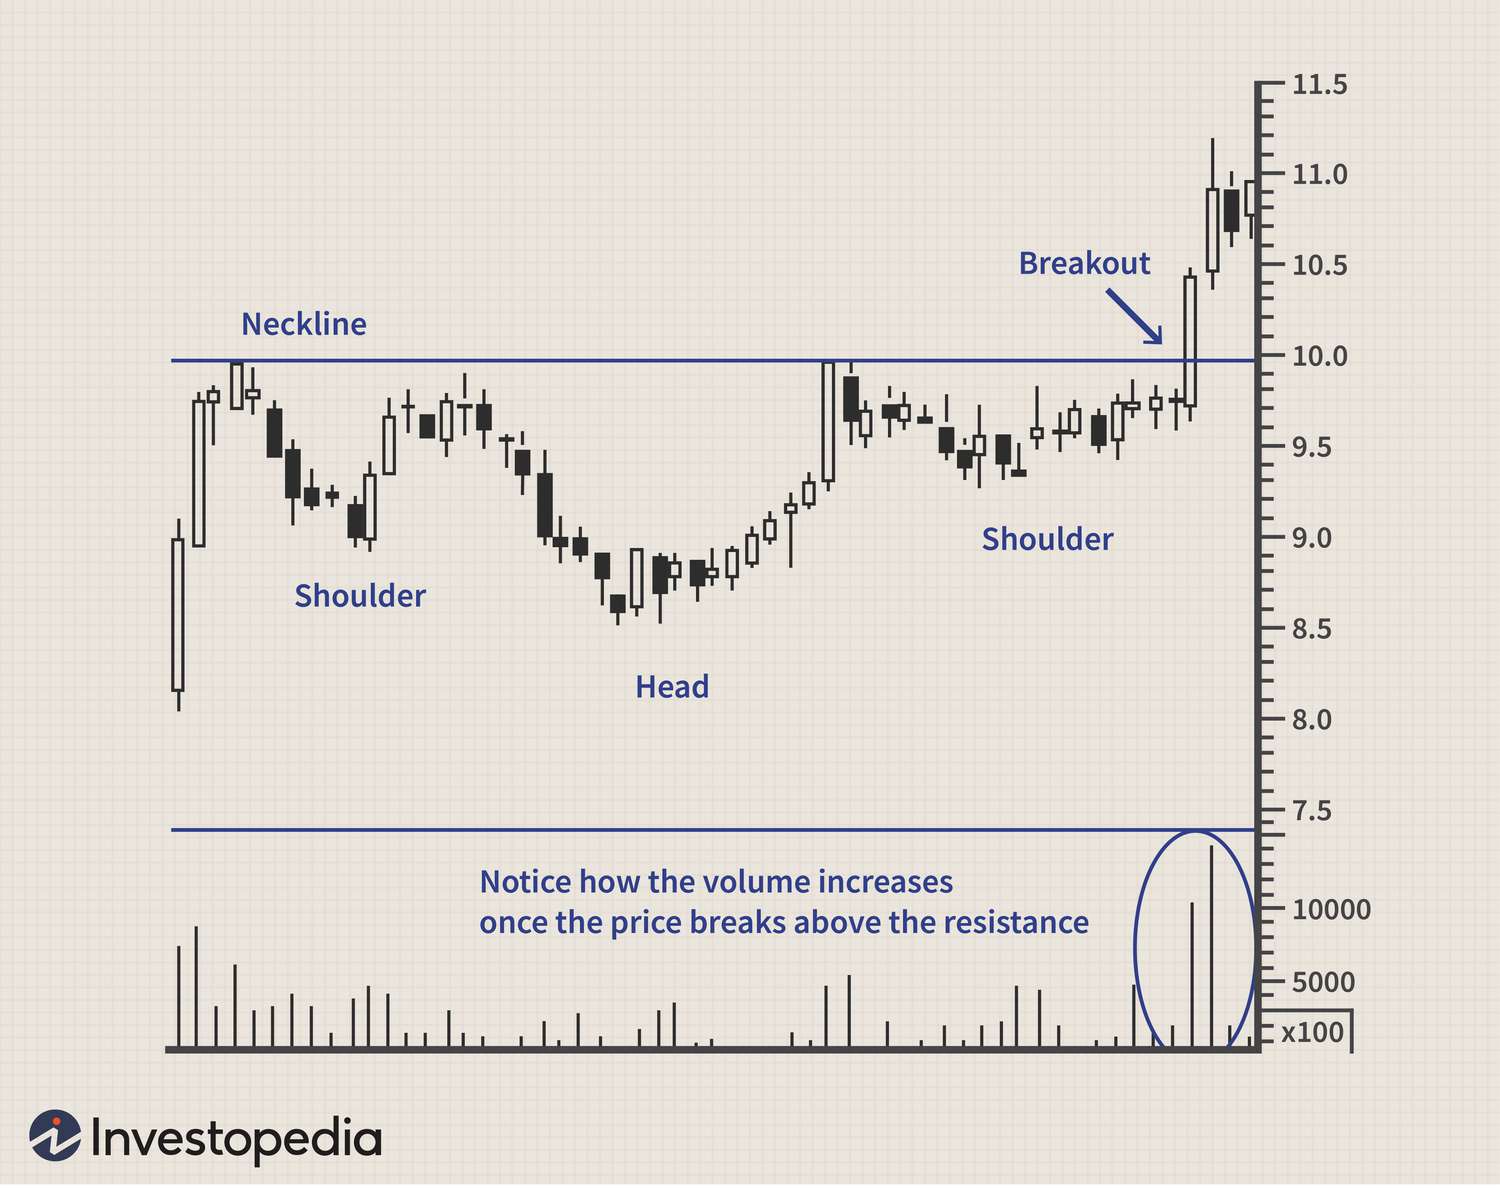
Volume Confirmation During Inverse Head and Shoulders Breakout
Source: Investopedia
This declining volume trend indicates that bullish conviction is fading, making the eventual breakdown more reliable.
4. The Neckline
The neckline isn't always perfectly horizontal. It can slope upward or downward. A downward-sloping neckline is actually considered more bearish than a flat or upward-sloping one, as it shows that buyers are already losing ground before the breakdown occurs.
Trading the Head and Shoulders Pattern: A Step-by-Step Approach
Identifying the pattern is only half the battle. Here's how to trade it systematically:
1
Wait for the Breakout
Never enter a short position until price closes below the neckline. Premature entries based on the assumption that the pattern will complete are a common source of losses. Patience is essential.
2
Determine Your Entry Point
The classic entry is triggered immediately after the neckline break. However, many experienced traders wait for a retest of the neckline from below. This retest often acts as resistance-turned-support and provides a more favorable risk-to-reward ratio.
3
Set Your Price Target
The measured move target is calculated by measuring the vertical distance from the head to the neckline, then subtracting that distance from the breakout point below the neckline.
4
Place Your Stop Loss
Risk management is non-negotiable. Place your stop loss above the right shoulder for the most conservative approach, or above the head if you're willing to accept wider risk for a higher probability setup.
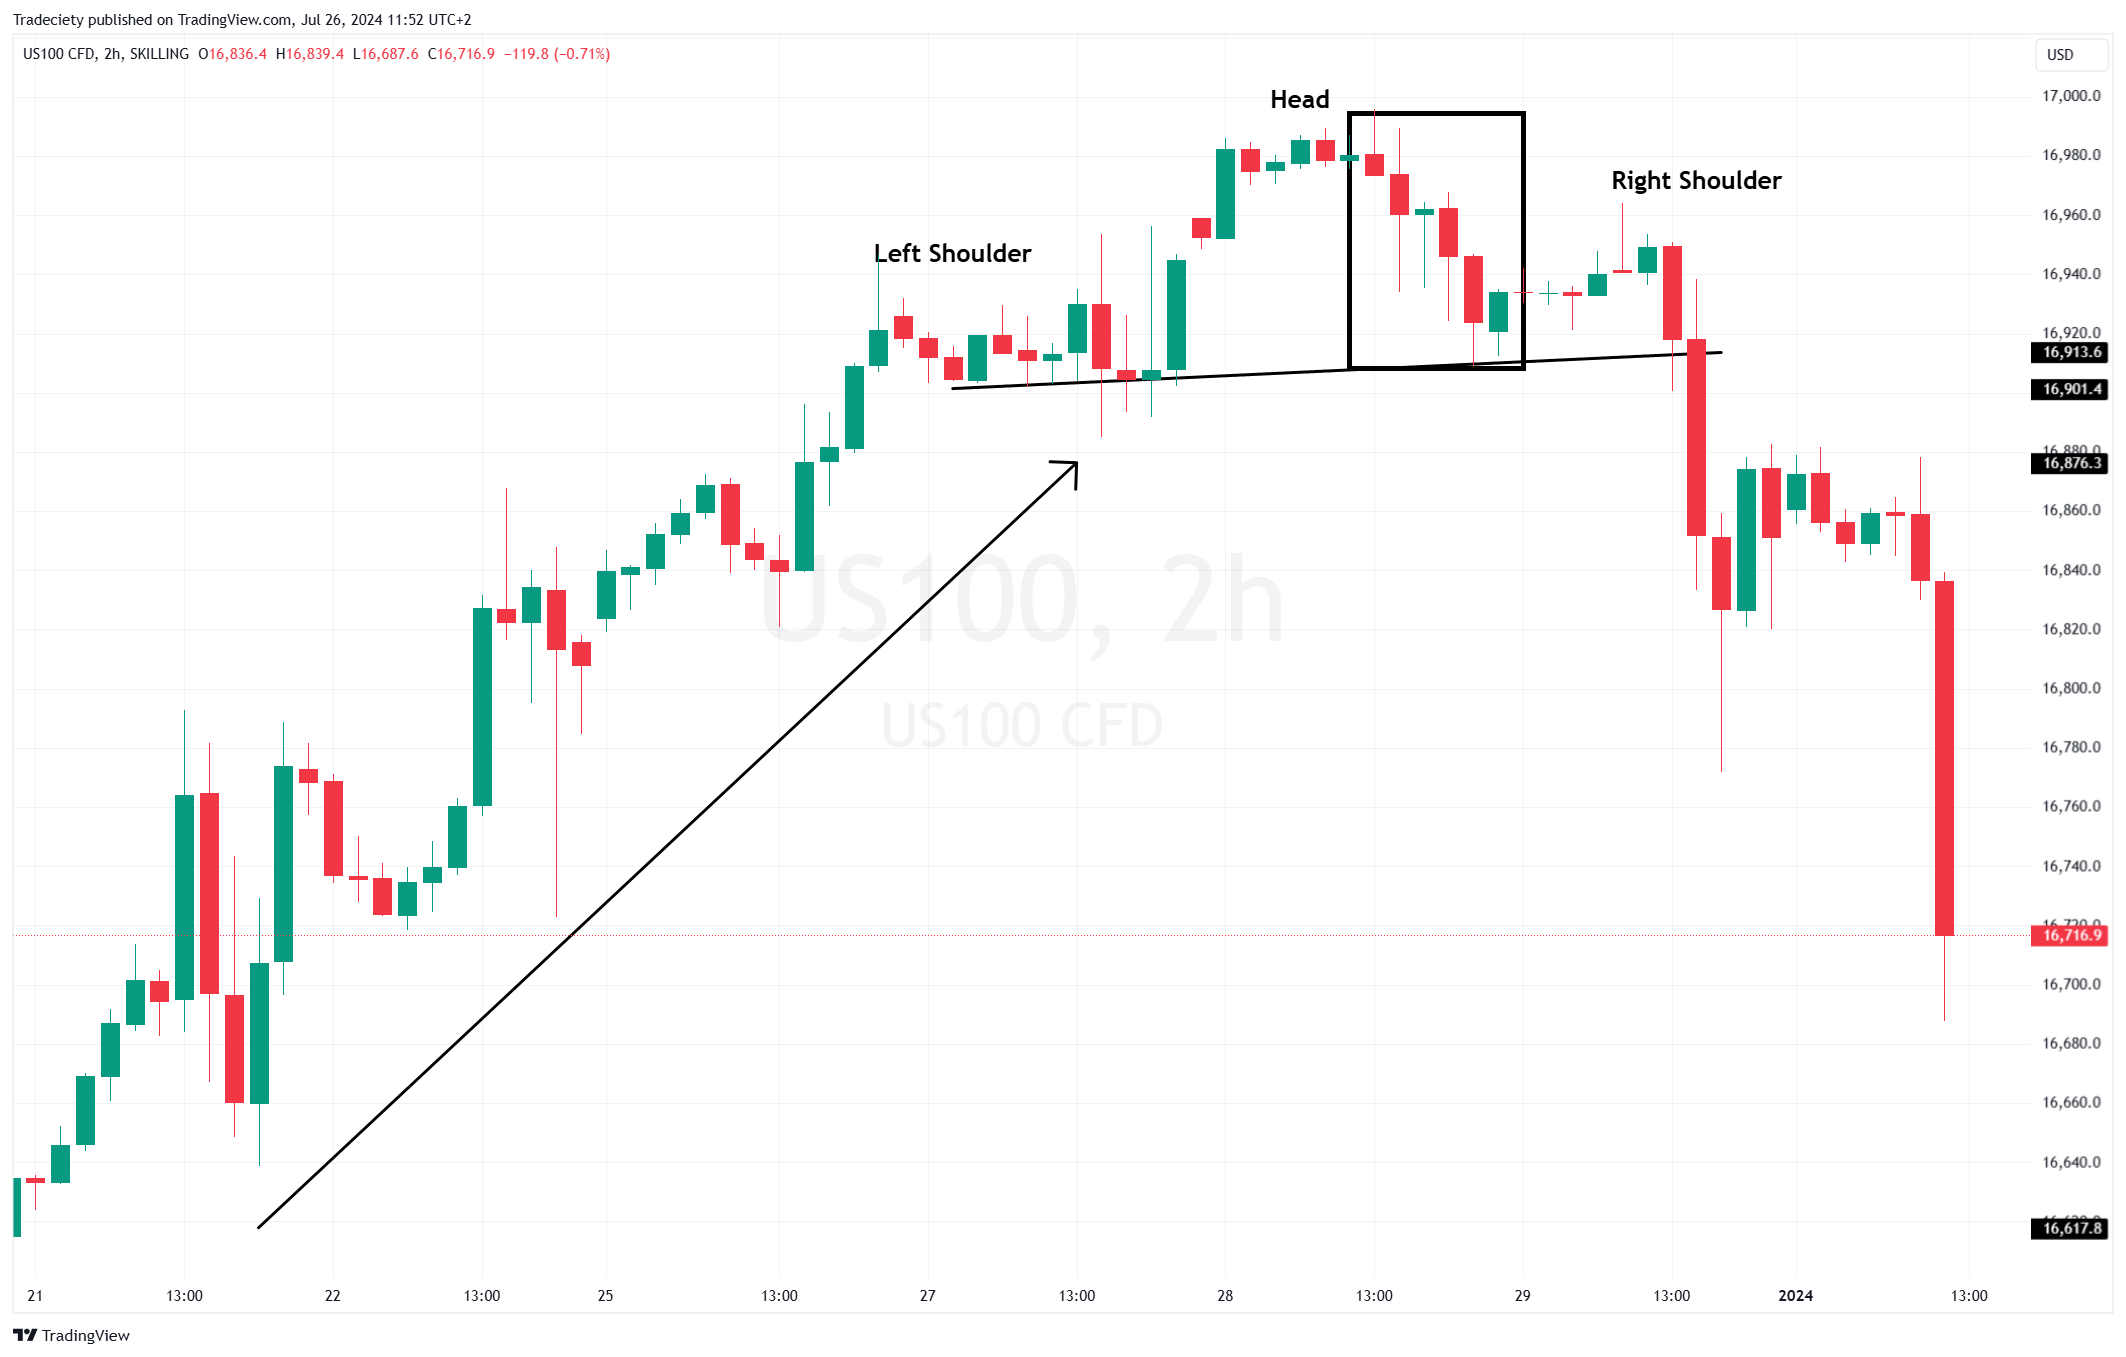
Real-World Head and Shoulders Pattern on US100 CFD
Source: Tradeciety / TradingView
Common Mistakes Traders Make
Even experienced traders fall into predictable traps when trading the Head and Shoulders pattern. Avoid these pitfalls:
🚫 Anticipating the Pattern
Trying to predict the right shoulder before it forms often leads to premature entries. Wait for the pattern to complete and the neckline to break.
🚫 Ignoring the Broader Context
A Head and Shoulders pattern on a 15-minute chart during a strong daily uptrend is far less reliable than one forming on a daily chart after a multi-month rally. Always consider the higher time frame trend.
🚫 Neglecting Volume
A breakout on low volume is suspect. It may indicate a false breakdown or "bear trap." Always look for volume confirmation before committing significant capital.
🚫 Forgetting to Adjust for Market Conditions
In highly volatile markets, price may whipsaw around the neckline multiple times before committing to a direction. Using a closing price filter can help filter out noise.
Real-World Example
📈 Practical Scenario
Imagine a stock that has rallied from $80 to $140 over six months. It forms a left shoulder at $135, pulls back to $125, rallies to a new high at $150 (the head), pulls back again to $125, and then makes a final push to $132 (the right shoulder) before rolling over.
The neckline sits at $125. When price breaks below $125 on heavy volume, the pattern activates. The measured target is $150 - $125 = $25, subtracted from $125, giving a target of $100. A trader entering at $123 with a stop at $138 risks $15 to potentially gain $23—a respectable 1.5:1 risk-reward ratio.
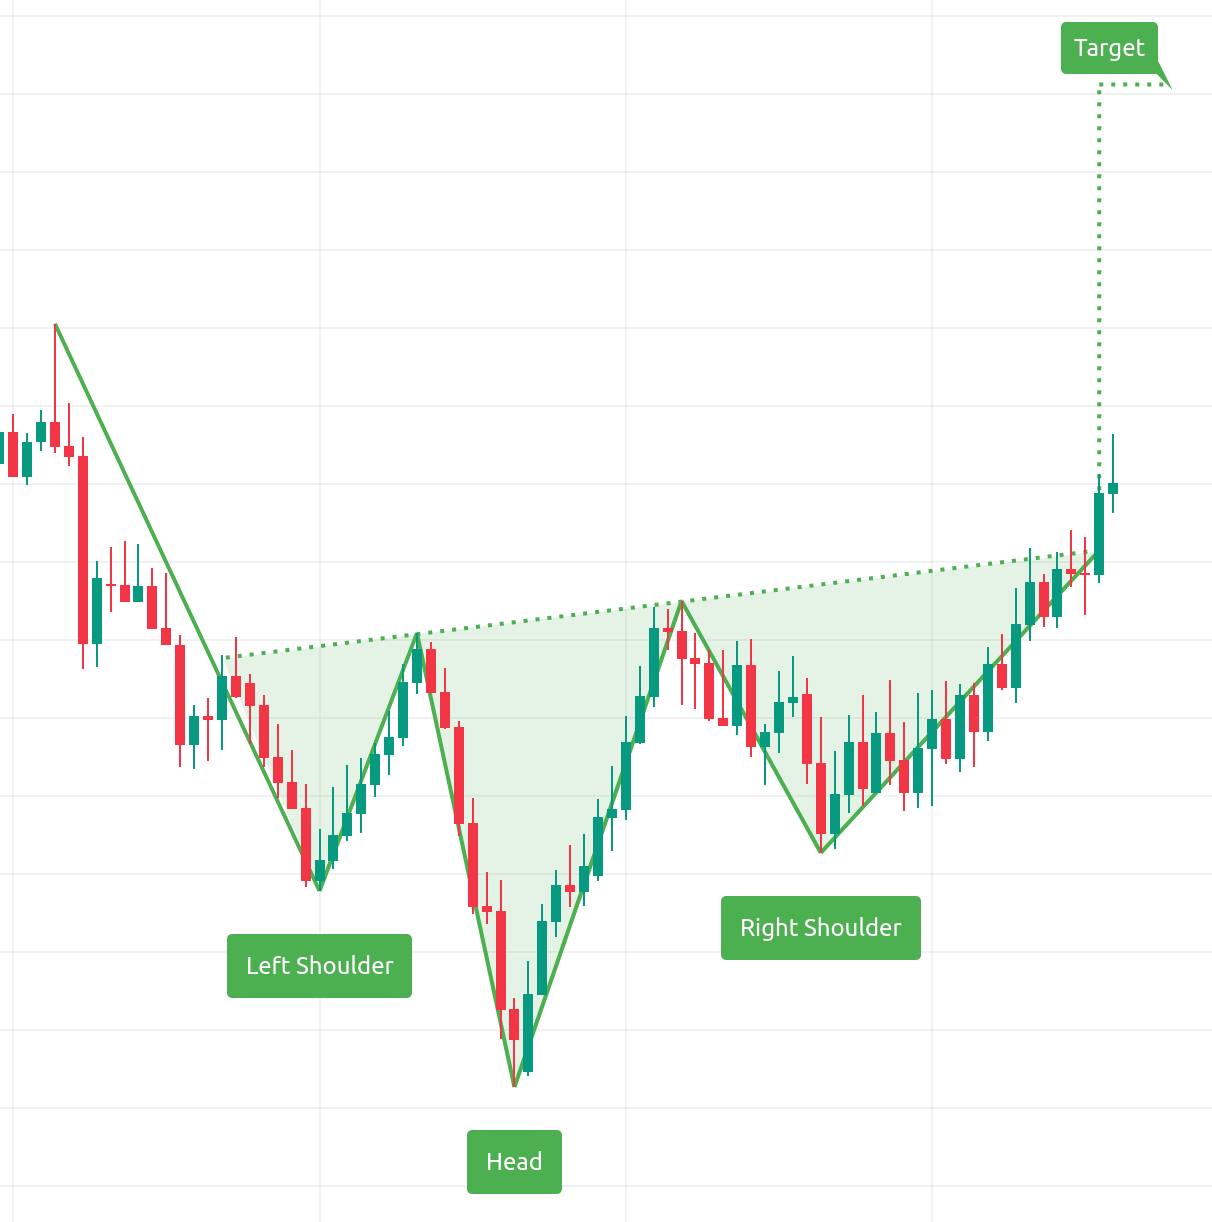
Inverse Head and Shoulders Pattern with Price Target Projection
Source: TradingView
Why This Pattern Works
The Head and Shoulders pattern is effective because it captures the psychological transition from bullish dominance to bearish control. The left shoulder shows eager buyers. The head shows the last gasp of bullish exuberance. The right shoulder reveals that buyers are exhausted and sellers are gaining strength.
💡 Key Takeaway
By the time the neckline breaks, the market has already tipped its hand. Traders who recognize this transition early can position themselves ahead of the crowd.
Final Thoughts
The Head and Shoulders pattern remains a cornerstone of technical analysis for good reason. Its clear structure, measurable targets, and strong historical reliability make it an indispensable tool for traders in the United States and globally.
However, like any trading strategy, it is not infallible. No pattern works 100% of the time. The key to long-term success lies in combining pattern recognition with disciplined risk management, volume analysis, and awareness of the broader market environment.
If you're serious about improving your chart reading skills, spend time studying historical examples of this pattern across different time frames and asset classes. The more you train your eye to spot these formations in real-time, the more confident you'll become in executing high-probability trades.
Disclaimer: This article is for educational purposes only and does not constitute financial advice. Trading involves substantial risk of loss. Always conduct your own research and consider consulting a licensed financial advisor before making investment decisions. Past performance is not indicative of future results.


Comments
Post a Comment