Flag Pattern Trading Strategy: Bull & Bear Flags Explained
📊 The Flag Pattern
A Complete Guide to Mastering This Classic Chart Formation for U.S. Market Traders
In the world of technical analysis, chart patterns serve as the backbone of price action trading. Among the most reliable and frequently observed formations is the flag pattern — a continuation pattern that signals a brief pause in a strong trend before the price resumes its original trajectory. Whether you are a day trader scanning the Nasdaq, a swing trader monitoring the S&P 500, or a long-term investor analyzing individual equities, understanding the flag pattern can significantly enhance your ability to time entries and exits with precision.
This guide provides an in-depth exploration of the flag pattern, its structure, psychology, variations, trading strategies, and risk management techniques tailored for traders operating in the United States financial markets.
🎯 What Is a Flag Pattern?
A flag pattern is a continuation chart pattern that forms after a strong, nearly vertical price movement known as the "flagpole." Following this sharp advance or decline, the price enters a consolidation phase where it moves counter to the prevailing trend, creating a rectangular or parallelogram-shaped channel that resembles a flag on a pole. Once the consolidation completes, the price typically breaks out in the direction of the original trend, continuing the move with momentum comparable to the initial flagpole.
The flag pattern is widely respected among American traders because it appears across all timeframes — from one-minute charts favored by scalpers on the NYSE to monthly charts used by institutional portfolio managers. Its universal applicability makes it one of the most versatile tools in a trader's arsenal.
🏗️ Anatomy of the Flag Pattern
To identify a flag pattern accurately, traders must recognize its two primary components:
1. The Flagpole
The flagpole represents the initial impulsive move. In a bullish flag , this is a sharp upward surge characterized by high volume and strong buying pressure. In a bearish flag , the flagpole is a steep downward drop driven by intense selling pressure. The flagpole establishes the trend direction and sets the stage for the subsequent consolidation. The stronger and more vertical the flagpole, the more reliable the pattern tends to be.
2. The Flag (Consolidation)
After the flagpole, the price enters a consolidation phase. This is where the "flag" forms. The consolidation typically moves against the trend — slightly downward in a bullish flag and slightly upward in a bearish flag. The price action is contained within two parallel trendlines that slope in the opposite direction of the prevailing trend. Volume during this phase usually contracts, indicating a temporary equilibrium between buyers and sellers as the market catches its breath.
Key Rule: The consolidation should not retrace more than 50% of the flagpole's move. Ideally, the retracement stays within the 23.6% to 38.2% Fibonacci levels. A deeper retracement may signal weakness and reduce the pattern's reliability.
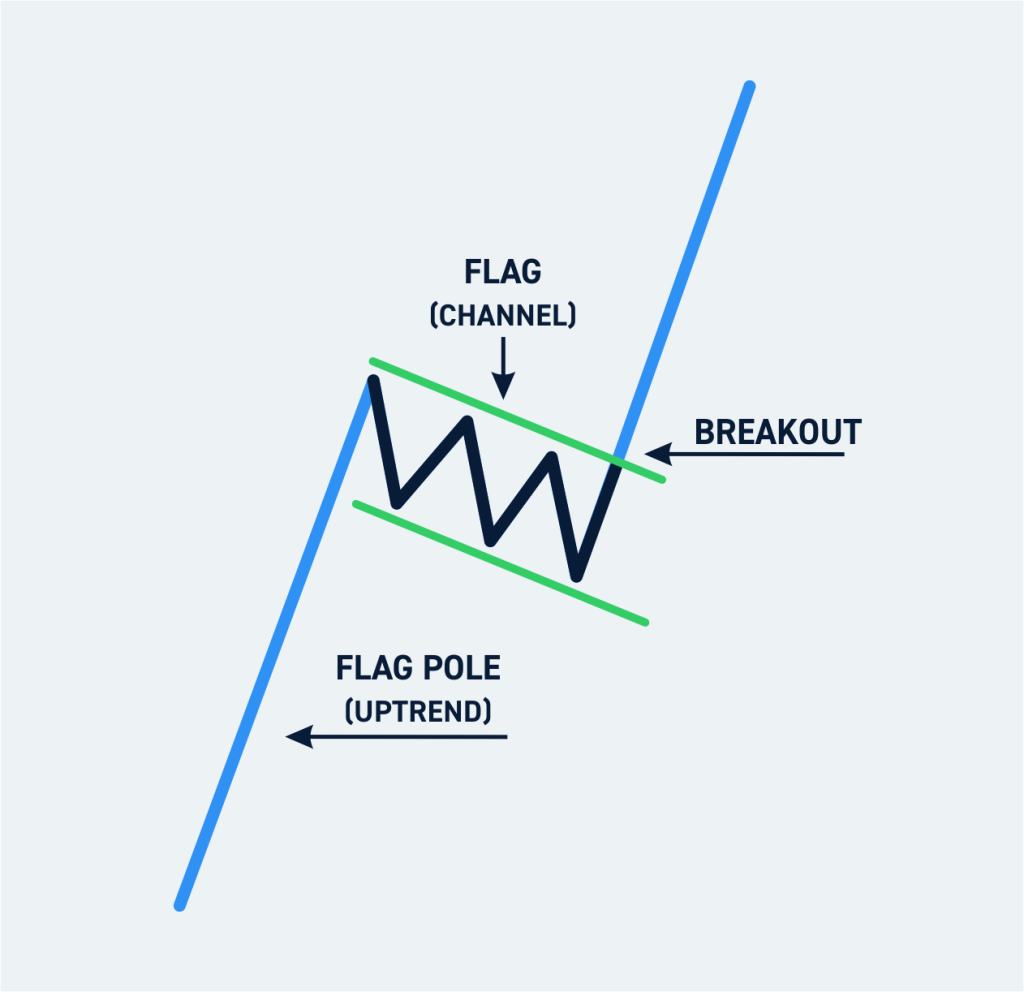
Figure 1: Anatomy of a Bull Flag Pattern — Flag Pole, Flag Channel, and Breakout
📈📉 Types of Flag Patterns
Bullish Flag (Flag Pattern in an Uptrend)
A bullish flag forms after a strong upward price surge. The consolidation that follows slopes gently downward or moves sideways. This pattern indicates that buyers are merely pausing before resuming control. Once the price breaks above the upper boundary of the flag with increased volume, a long position becomes attractive.
Example Scenario: Imagine shares of a major U.S. technology company surging 15% in three days following a better-than-expected earnings report. Over the next week, the stock drifts lower by 3% in a tight, parallel channel on declining volume. This is a classic bullish flag. A breakout above the channel's upper trendline with a spike in volume would signal a continuation of the uptrend, potentially targeting a price equal to the height of the flagpole added to the breakout point.
Bearish Flag (Flag Pattern in a Downtrend)
A bearish flag forms after a sharp downward move. The consolidation slopes gently upward or moves sideways, representing a brief respite for sellers. The pattern suggests that selling pressure will resume once the price breaks below the lower boundary of the flag.
Example Scenario: Consider a regional bank stock that plummets 20% in two days due to regulatory concerns. Over the following sessions, the stock bounces modestly by 4% in a narrow, upward-sloping channel. This bearish flag indicates that the selling is not over. A breakdown below the lower trendline with expanding volume would confirm the pattern, with a price target calculated by subtracting the flagpole's height from the breakdown point.
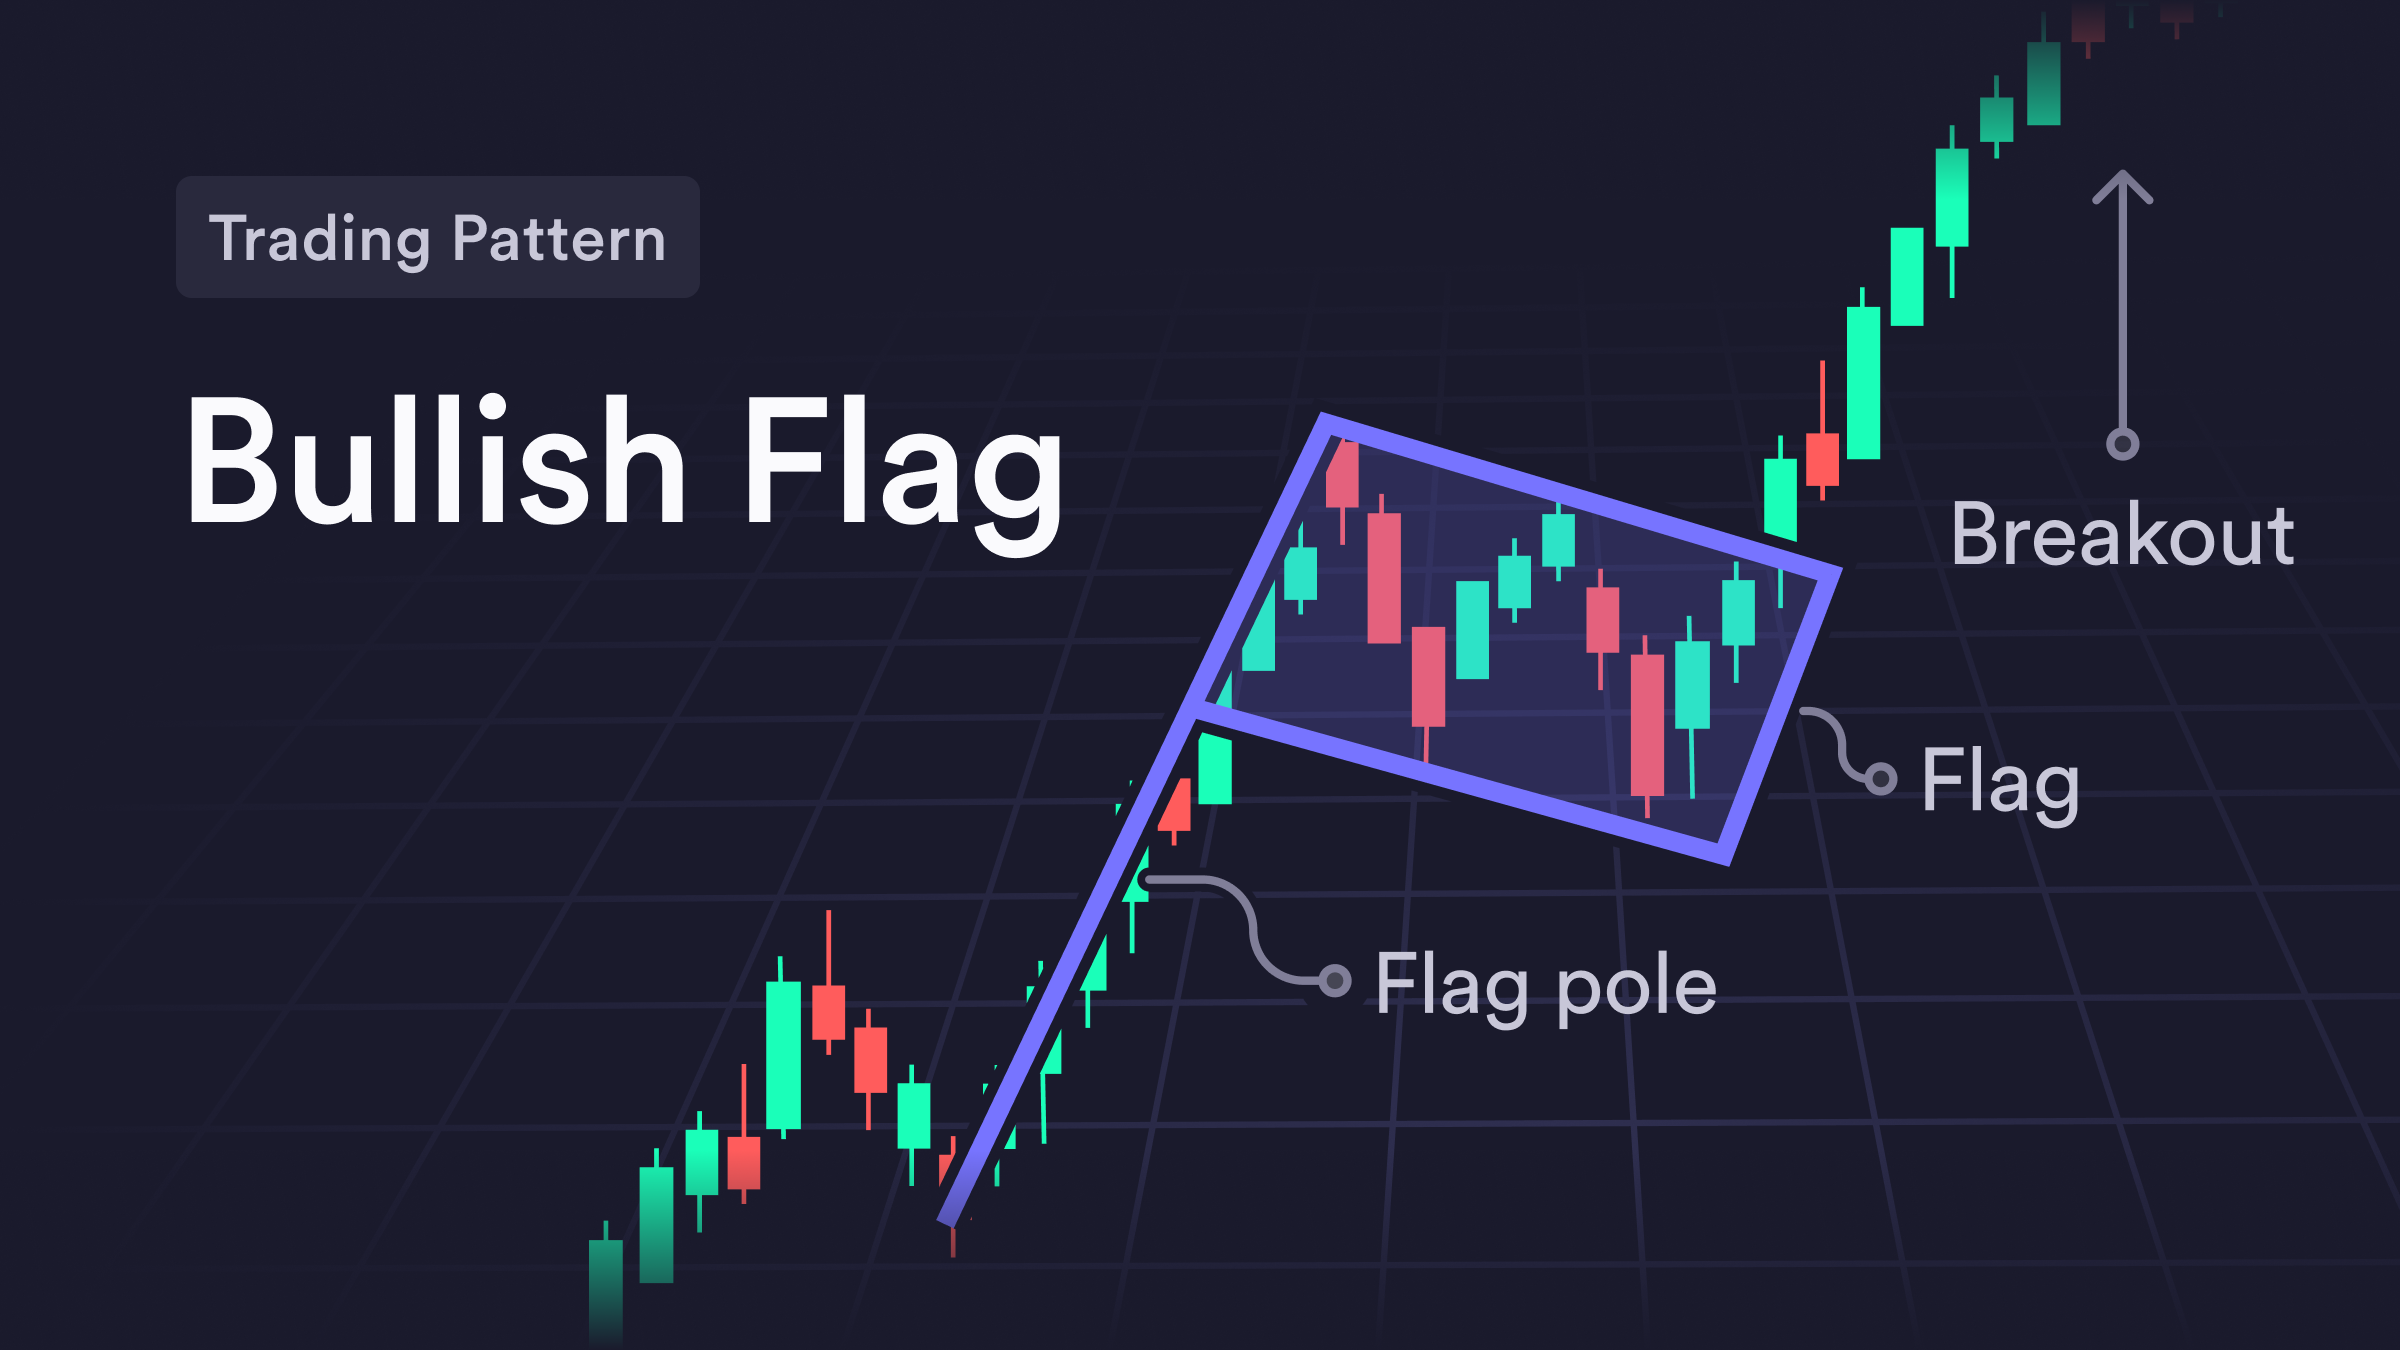
Figure 2: Bullish Flag Pattern — Strong uptrend, consolidation phase, and breakout continuation
🧠 The Psychology Behind the Flag Pattern
Understanding the psychology driving the flag pattern is essential for traders who want to move beyond mechanical pattern recognition. The flagpole is driven by a strong imbalance between buyers and sellers — often triggered by fundamental catalysts such as Federal Reserve policy announcements, corporate earnings beats or misses, or geopolitical developments.
The consolidation phase represents profit-taking by early entrants and tentative positioning by counter-trend traders who believe the move is overextended. However, institutional players and informed money often use this consolidation to accumulate additional positions in the direction of the trend. The contracting volume during the flag indicates that the counter-trend pressure is weak and that the dominant force — buyers in a bullish flag or sellers in a bearish flag — remains in control.
When the price breaks out of the flag, it signals that the dominant group has reasserted itself, and the trend is ready to continue. This psychological dynamic is why flag patterns are considered high-probability setups when traded with proper confirmation.
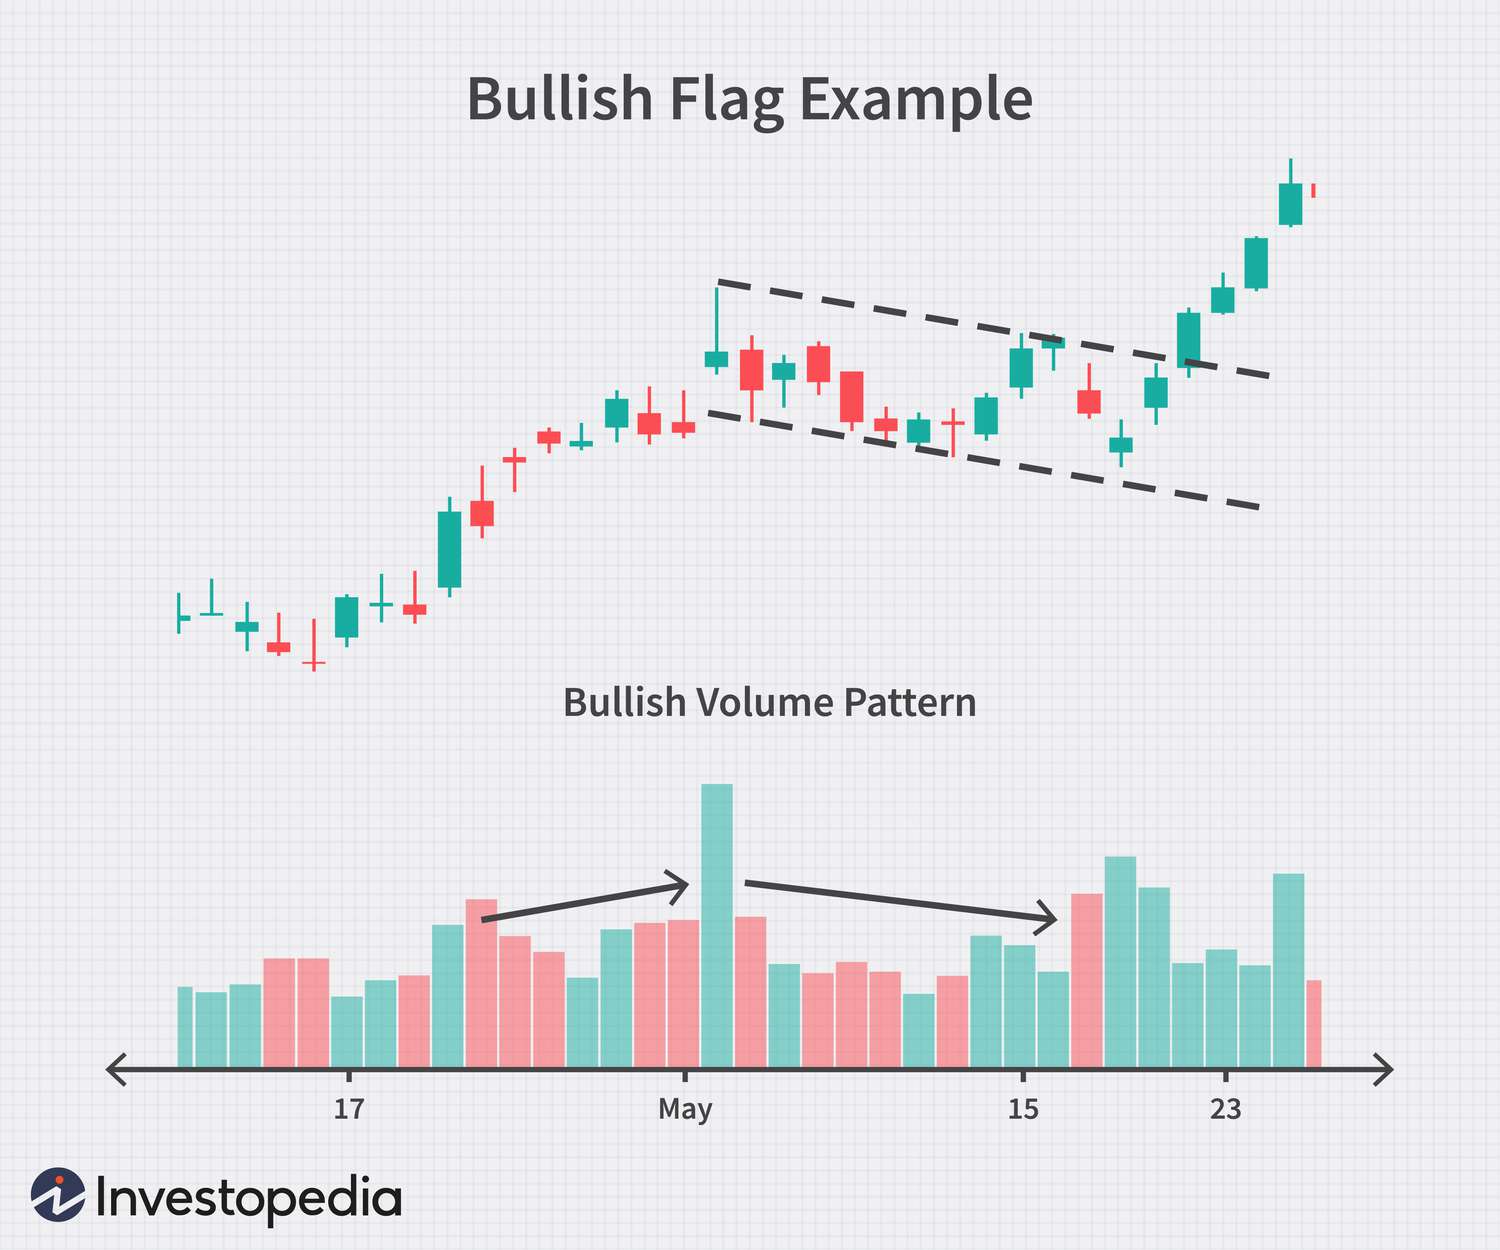
Figure 3: Bullish Flag Example with Volume Pattern — High volume on flagpole, declining volume during consolidation, and volume spike on breakout
⚡ How to Trade the Flag Pattern
-
1
Identify the Pattern
Begin by locating a strong impulsive move on your chart. Ensure the move is supported by above-average volume. Then, look for a consolidation phase with parallel trendlines that slope against the trend. The consolidation should last no more than a few weeks — ideally between five to twenty trading sessions. -
2
Wait for Confirmation
Never enter a trade before the breakout. Wait for the price to close decisively above the upper trendline (for bullish flags) or below the lower trendline (for bearish flags) on volume that exceeds the average of the consolidation period. A breakout on low volume is suspect and may result in a false signal or "fakeout." -
3
Determine Entry Points
The most conservative entry is placed immediately after the breakout candle closes beyond the flag's boundary. More aggressive traders may enter on the breakout itself, while cautious traders might wait for a retest of the broken trendline, which often acts as new support or resistance. -
4
Set Price Targets
The classic measured move for a flag pattern is calculated by taking the height of the flagpole and projecting it from the breakout point. -
5
Manage Risk with Stop Losses
Place a stop-loss order on the opposite side of the flag pattern. For a bullish flag, the stop should sit below the lowest point of the consolidation. For a bearish flag, the stop goes above the highest point of the consolidation.
Bearish Flag Target = Breakout Price − Flagpole Height
Risk-to-Reward Rule: The risk-to-reward ratio should ideally be at least 1:2, meaning your potential profit is twice your potential loss.
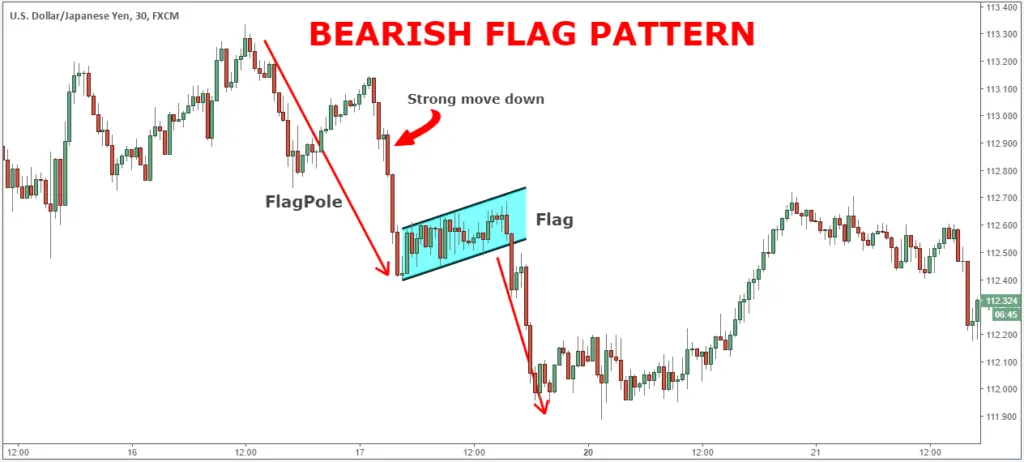
Figure 4: Bearish Flag Pattern — Strong move down, flag consolidation, and continuation lower
🔀 Common Variations and Related Patterns
The Pennant
A pennant is closely related to the flag but differs in shape. While a flag features parallel trendlines creating a rectangular channel, a pennant has converging trendlines that form a small symmetrical triangle. The trading approach for pennants is nearly identical to that of flags.
The High and Tight Flag
Popularized by renowned investor William O'Neil, the high and tight flag is a particularly powerful bullish variation. It forms after a stock doubles in price within a short period — typically four to eight weeks — and then consolidates in a tight range of no more than 10% to 15%. These patterns often lead to explosive continuation moves and are favorites among momentum traders in the U.S. equity markets.
The Falling Wedge and Rising Wedge
Though technically distinct patterns, wedges can sometimes be confused with flags. A falling wedge in an uptrend is bullish, while a rising wedge in a downtrend is bearish. The key difference is that wedges have converging trendlines, whereas flags have parallel ones.
🇺🇸 Real-World Application in U.S. Markets
Flag patterns are especially prevalent in the highly liquid U.S. markets, where institutional participation creates clean, tradable formations. Large-cap stocks listed on the NYSE and Nasdaq, major ETFs such as SPY and QQQ, and futures contracts on the CME regularly exhibit flag patterns around earnings seasons, Federal Reserve meetings, and macroeconomic data releases.
For example, during the technology sector rally of early 2024, numerous semiconductor stocks displayed bullish flag patterns after breaking out to new highs. Traders who recognized these formations and entered on volume-confirmed breakouts captured significant portions of the subsequent moves. Conversely, during periods of market stress — such as banking sector turmoil — bearish flags on financial stocks provided clear short-selling opportunities for hedge funds and active traders.
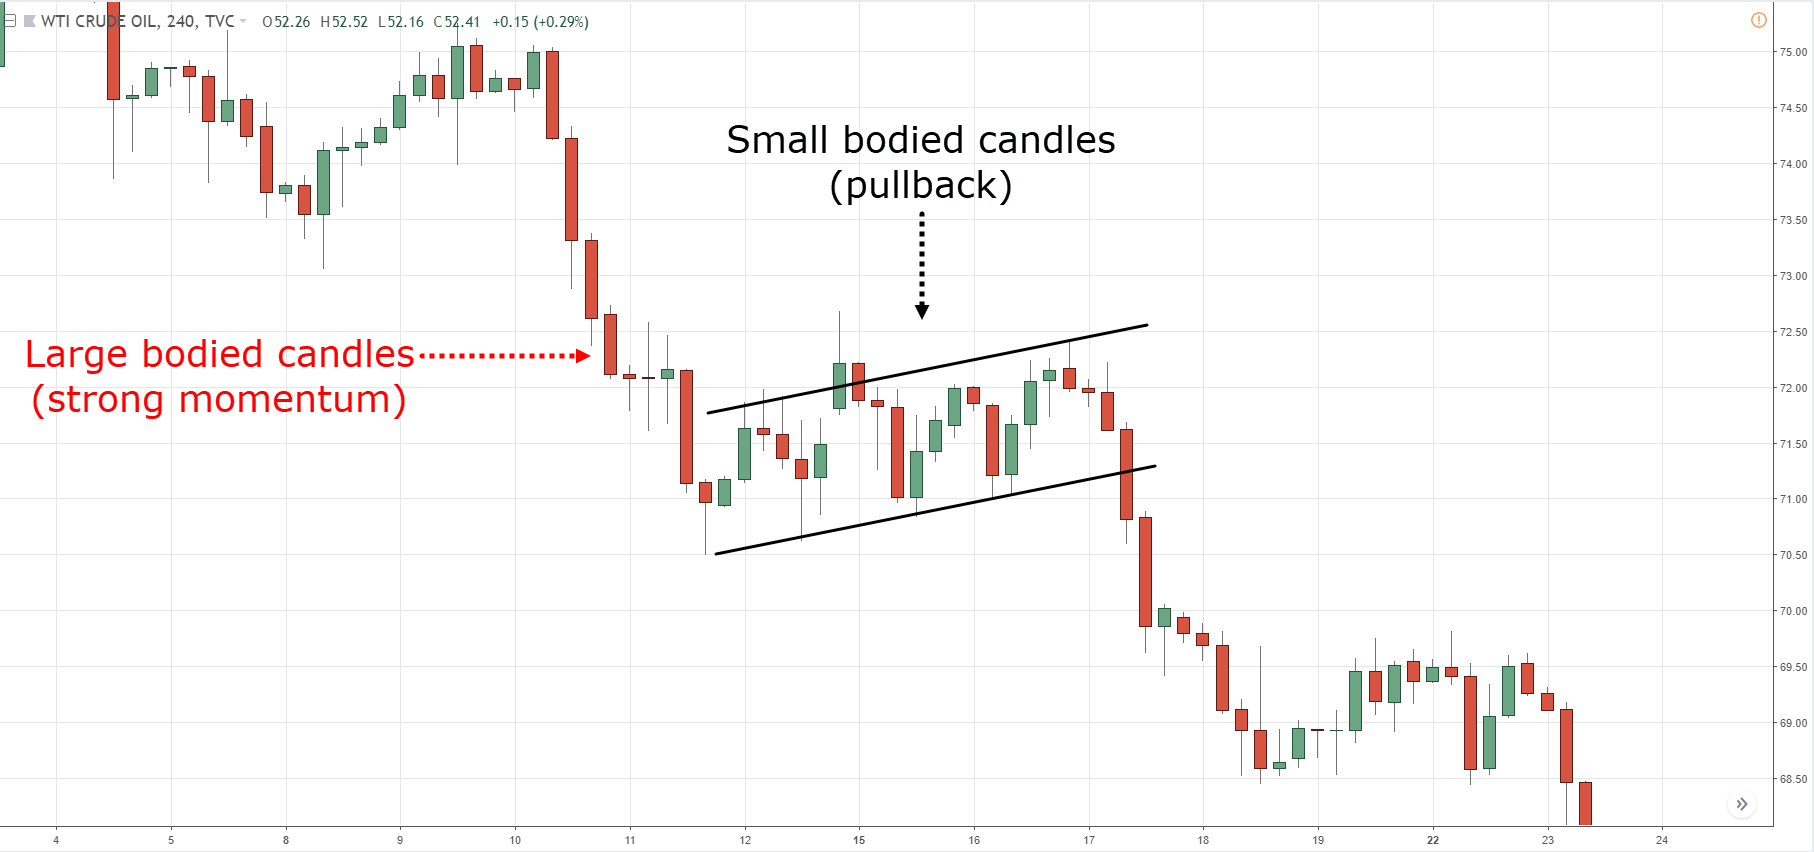
Figure 5: Bear Flag Trading Strategy — Large bodied candles (strong momentum) followed by small bodied candles (pullback/consolidation)
⚠️ Risk Management and Limitations
No chart pattern is infallible, and the flag pattern is no exception. False breakouts occur when the price briefly moves beyond the flag's boundary before reversing sharply. To mitigate this risk, traders should:
⚡ Key Risk Management Rules
- Require volume confirmation: A breakout without volume support has a higher probability of failure.
- Use multiple timeframes: Confirm the pattern on a higher timeframe to ensure alignment with the broader trend.
- Avoid trading in isolation: Combine flag patterns with other technical tools such as moving averages, Relative Strength Index (RSI), and support/resistance levels.
- Respect market context: Flag patterns perform best in trending markets. In choppy, range-bound conditions, their reliability diminishes significantly.
Additionally, traders should be aware of broader market risks — such as unexpected Federal Reserve announcements, geopolitical shocks, or sector-specific news — that can invalidate technical patterns regardless of how well-formed they appear.
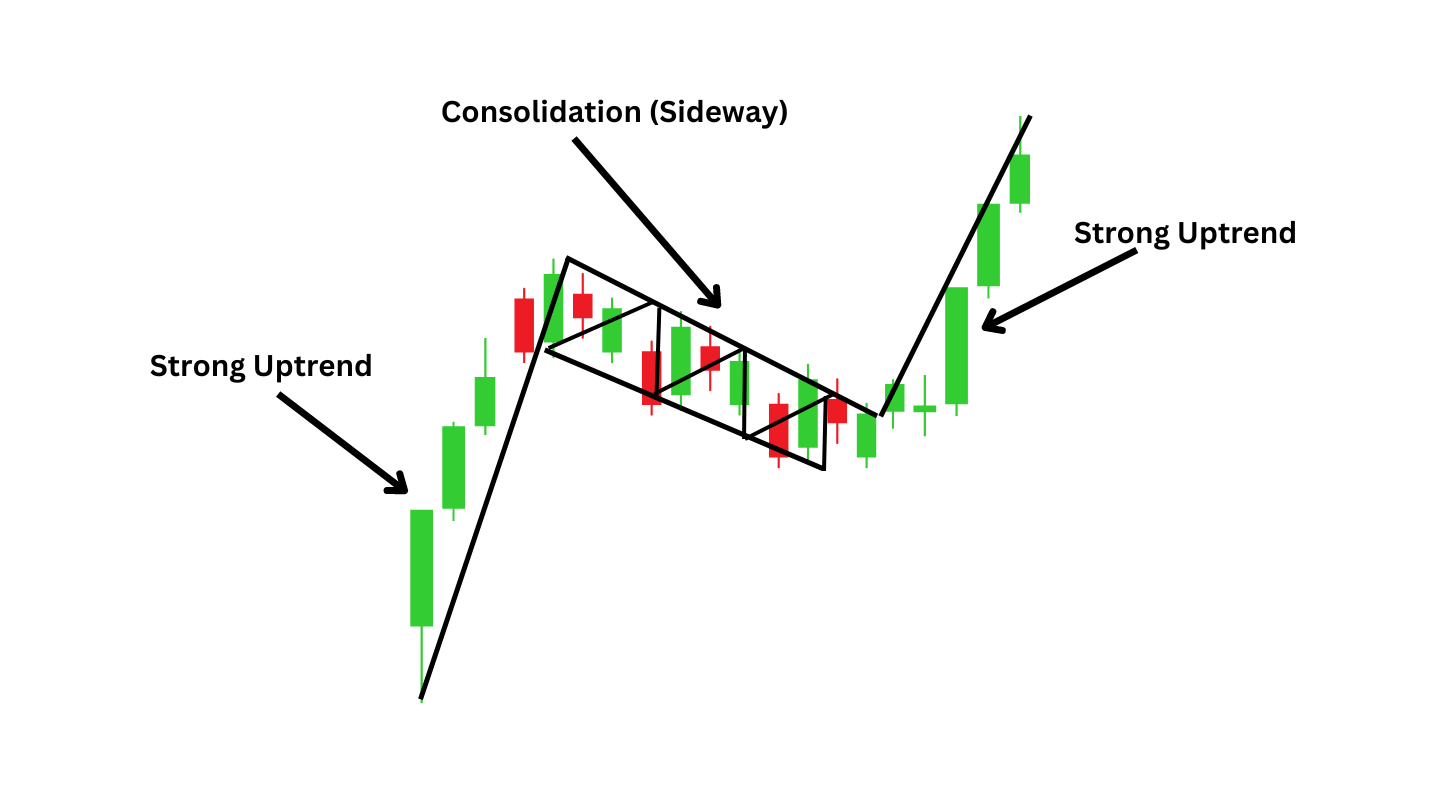
Figure 6: Bull Flag Pattern — Strong uptrend followed by consolidation (sideways) and trend continuation
🏆 Conclusion
The flag pattern remains one of the most effective and time-tested tools in technical analysis. Its simplicity, combined with its strong statistical edge in trending markets, makes it indispensable for traders navigating the fast-paced U.S. financial landscape. By mastering the identification, confirmation, and execution of flag patterns, traders can align themselves with institutional flow and capitalize on high-probability continuation moves.
Success with flag patterns demands patience, discipline, and rigorous risk management. Wait for the breakout. Confirm with volume. Measure your target. Protect your capital. When these principles are applied consistently, the flag pattern transforms from a simple chart shape into a powerful framework for capturing momentum in the world's most dynamic markets.


Comments
Post a Comment