Amazon Stock (AMZN) at $266: AWS Hits $169 Billion Run Rate as AI Revenue Explodes Past $25 Billion
Published: August 29, 2026 | Reading Time: 8 min | Market Analysis
Amazon is reminding Wall Street why it is the most dominant force in American commerce and cloud computing. On Thursday, August 28, 2026, Amazon.com (NASDAQ: AMZN) stock surged $10.17 (+3.97%) to close at $266.43 — a powerful rebound that has investors asking whether the e-commerce and cloud giant is gearing up for another run at its all-time high of $287.20 set just weeks ago on August 3.
For the millions of American investors holding AMZN in their brokerage accounts, retirement portfolios, and index funds, the latest quarterly results paint a picture of a company firing on all cylinders. Revenue crossed $200 billion in a single quarter for the first time ever. AWS growth accelerated to its fastest pace in four and a half years. AI revenue exploded past $25 billion annually. And Prime Day 2026 shattered records with $26.4 billion in US online spending.
Yet the stock remains roughly 7% below its peak, creating a potential entry point for investors who believe Amazon's best days are still ahead. Let us break down exactly what is driving this trillion-dollar machine — and what could come next.
Q2 2026 Earnings: The $200 Billion Quarter
On July 30, 2026, Amazon reported second-quarter financial results that left Wall Street stunned. Total net sales reached $200.6 billion, up 20% year-over-year from $167.7 billion and comfortably above analyst estimates of $196.47 billion. It was the first time Amazon has ever generated more than $200 billion in revenue during a single quarter.
Operating income surged 43% to $27.5 billion, compared with $19.2 billion in the same period last year. Net income reached an astronomical $62.6 billion, or $5.75 per diluted share, compared with $18.2 billion, or $1.68 per share, in Q2 2025. That EPS figure was boosted by a massive $53.4 billion non-operating pre-tax gain from Amazon's investment in Anthropic and other holdings — but even excluding that windfall, the underlying business performance was exceptional.
CEO Andy Jassy did not mince words on the earnings call. "AWS is booming, growing 36.7% year-over-year in Q2... and our AI and Chips businesses each eclipsed run rates of more than $25 billion," he said. "AWS is now a $169 billion annualized revenue run rate business, which, for perspective, would place it 24th on the Fortune 500 list if it was a standalone company."
CFO Brian Olsavsky noted that the quarter benefited from two one-time items totaling approximately $1.2 billion: roughly $600 million in tariff-related refunds and another $600 million related to changes in fair value measurement of energy contracts. Even adjusting for these benefits, operating income growth was robust.
AWS: The $169 Billion Engine That Keeps Accelerating
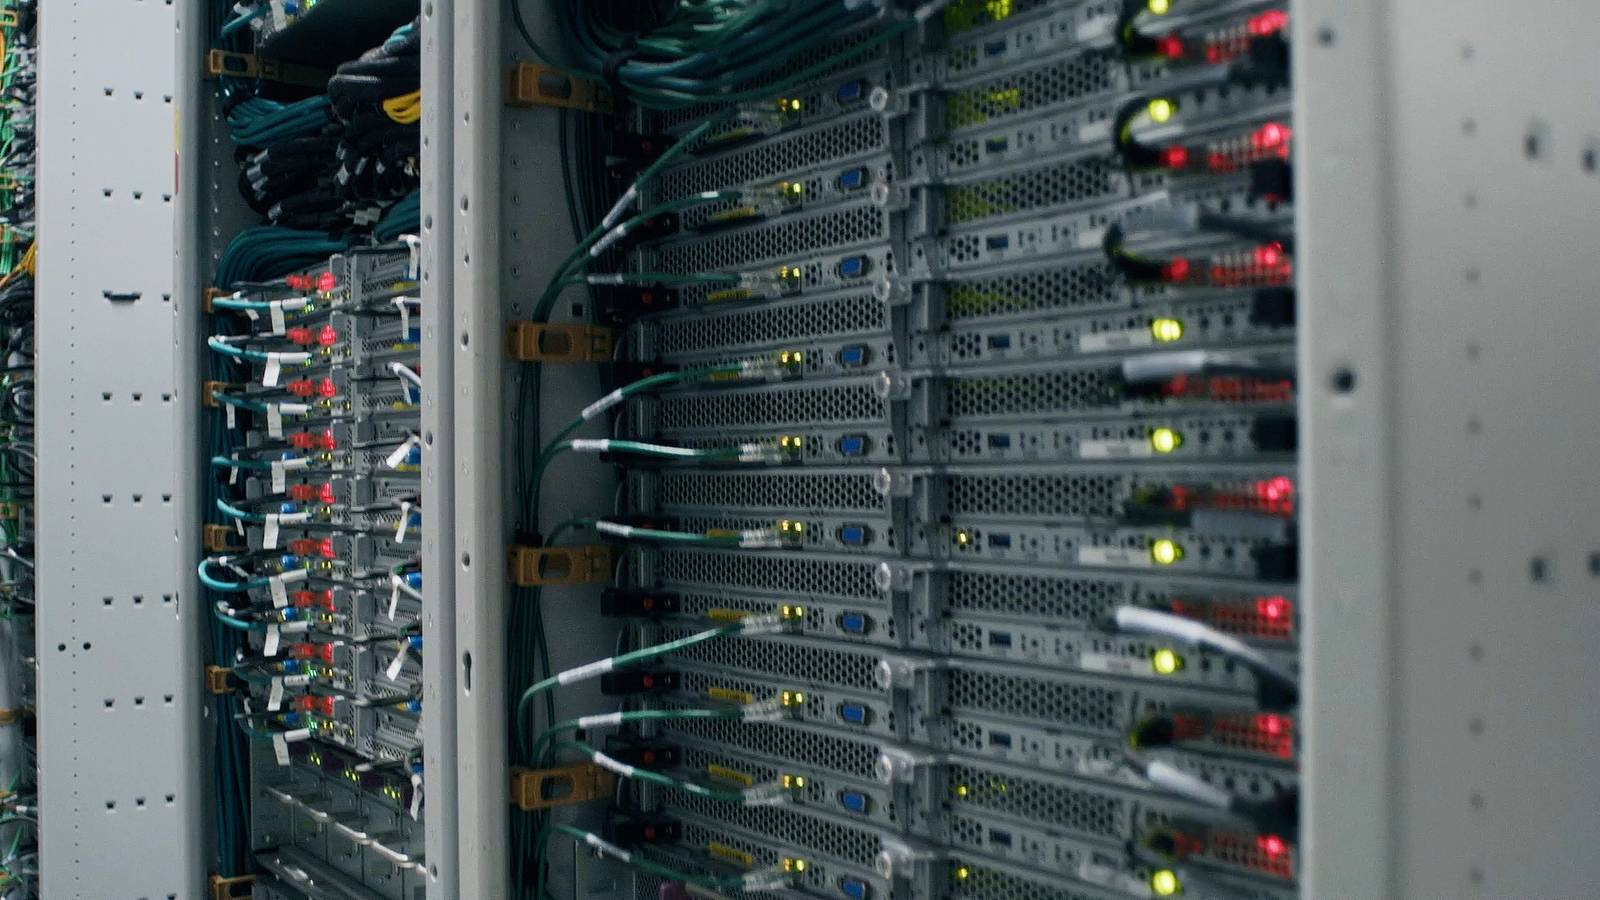
The crown jewel of Amazon's empire — Amazon Web Services — delivered its most impressive quarter in years. AWS revenue came in at $42.2 billion, representing year-over-year growth of 36.7% and marking the fifth consecutive quarter of accelerating growth. Analysts had projected 31% growth, meaning AWS beat expectations by nearly six full percentage points.
AWS operating income reached $16.6 billion, up from $10.2 billion a year earlier, at an operating margin of 39.4%. That margin expansion — up 650 basis points year-over-year, or 520 basis points excluding the energy contract benefit — demonstrates that Amazon is scaling its cloud business with remarkable efficiency despite massive infrastructure investments.
The growth is being driven by two powerful forces. First, core cloud migration continues as enterprises move more workloads to AWS. Second, and more exciting for investors, AI demand is exploding. Amazon disclosed that its AI revenue run rate climbed significantly quarter-over-quarter and is now also over $25 billion, growing at triple-digit percentages year-over-year. The company's custom Trainium chips and Graviton processors are gaining serious traction — Graviton is now used by 98% of AWS's top 1,000 EC2 customers.
Perhaps most impressive is AWS's contracted backlog, which stands at $496 billion and is growing at triple-digit rates year-over-year. That backlog provides years of revenue visibility that few companies on earth can match. As Jassy put it: "Customers choose AWS because we offer the broadest capabilities. They want their AI inference to reside near their other applications and data, and more of it resides in AWS than anywhere else."
Prime Day 2026: $26.4 Billion and a Mobile Revolution
While AWS grabs the headlines, Amazon's retail business remains the foundation — and Prime Day 2026 proved it is stronger than ever. The four-day event, held June 23-26, generated $26.4 billion in total US ecommerce sales according to Adobe Analytics, up 9.3% from the $24.1 billion recorded in 2025.
Day one alone saw $8.3 billion in online spending, up 5.3% year-over-year. For the first time in Prime Day history, mobile revenue surpassed desktop, with smartphones generating 53.2% of online sales — roughly $12.8 billion. The shift to mobile represents a structural change in how Americans shop, with profound implications for Amazon's advertising and fulfillment strategies.
Top-selling categories included apparel and shoes (30% of buyers), household essentials (28%), health and wellness (27%), and beauty products (26%). Electronics saw a 120% sales lift versus average daily June sales, while appliances jumped 90%. Interestingly, shopper satisfaction dipped to 59% reporting high satisfaction with deals, down from 68% in 2025 — a sign that consumers are becoming more discerning even as they spend more.
The Prime Day timing shift — moving from July to June for most major markets — created some year-over-year comparison noise, but the underlying trend is clear: Amazon's retail flywheel continues to spin faster, with Prime membership growing at double-digit rates and same-day delivery expanding rapidly.

Advertising and Retail: The Other Growth Engines
Beyond AWS and Prime Day, Amazon's advertising business continues to emerge as a major profit center. Ad revenue grew 26% year-over-year to $19.8 billion in Q2, driven by Sponsored Products and increasing adoption of AI-powered ad formats. Shoppers who click sponsored prompts in Alexa+ and other conversational experiences convert to sales 48% more often and spend 21% more on average than non-clickers.
The North America segment generated $116.2 billion in revenue, up 16% year-over-year, with operating income of $9.1 billion (7.9% margin). The International segment contributed $42.2 billion, up 15%, with operating income of $1.7 billion (4.1% margin) — a notable improvement as Amazon continues to optimize its global fulfillment network.
Amazon's grocery business is also gaining momentum. The company is now the second-largest grocer in the United States, with monthly active perishables customers growing over 50% since the start of 2026. Same-day orders with perishables average over 3x more units per order, and fresh groceries now make up six of the top 20 best sellers on amazon.com.
Amazon Pharmacy is scaling rapidly too, with new customer growth of more than 2x in the first six months of the year and same-day prescription deliveries nearly 5x higher. The company saved customers nearly $250 million in out-of-pocket costs so far this year, up more than 400% year-over-year.
The $200 Billion CapEx Gamble: Building the AI Factory
Amazon's extraordinary growth does not come cheap. The company plans to invest approximately $200 billion in cash capital expenditures in 2026, the majority of which supports AI and AWS infrastructure. Property and equipment purchases on a trailing 12-month basis reached $169 billion, up 64% year-over-year.
Free cash flow on a trailing 12-month basis swung to an outflow of $7.6 billion from an inflow of $18.2 billion in the prior year period — a direct consequence of this massive buildout. For investors accustomed to Amazon's historically strong cash generation, the reversal is worth monitoring closely.
However, management has been clear that these investments will generate strong returns. AWS's operating margins have expanded despite the heavy spending, and the $496 billion backlog provides confidence that the capacity being built will be utilized. Amazon is also optimizing aggressively: the company increased Copilot workload throughput 4x since the start of the calendar year and is deploying next-generation robotics across its fulfillment network.
Jassy addressed the investment outlook directly: "We're enthusiastic about the ROIC equation, even with heavy CapEx the next few years." The bet is simple — Amazon is building the infrastructure that will power the AI economy for the next decade, and it intends to capture the lion's share of that spending.
Q3 Guidance and What to Expect Next
For the third quarter of 2026, Amazon guided for net sales between $197 billion and $202 billion, representing growth of 9% to 12% year-over-year. Operating income is expected between $22.5 billion and $26.5 billion.
CFO Olsavsky noted two factors creating sequential deceleration from Q2 to Q3. First, Prime Day timing shifted to Q2 this year from Q3 in 2025, creating roughly 400 basis points of headwind in the year-over-year comparison. Excluding Prime Day, Q3 growth would have been nearly 400 basis points higher. Second, foreign exchange rates are expected to create an unfavorable impact of approximately 80 basis points.
The guidance implies continued strong underlying momentum in AWS and advertising, even as the retail business laps the Prime Day shift. Investors will be watching closely to see if AWS can maintain its 35%+ growth rate and whether operating margins can hold above 10% at the consolidated level.
Where AMZN Stands Now: Key Metrics
As of the August 28 close, here is the complete picture for Amazon shareholders:
- Current Price: $266.43 (+3.97%)
- Previous Close: $256.26
- Day's Range: $257.78 - $267.56
- 52-Week Range: $196.00 - $287.20
- Market Cap: $2.87 Trillion
- P/E Ratio (Normalized): 37.21
- EPS (TTM): $7.16
- Volume: 50 million
- Average Volume: 49 million
- Price/Sales: 3.73
- Analyst Price Target: $323.09 - $327.00 (average)
At roughly 37x normalized earnings, Amazon is not cheap by traditional valuation standards. But for a company growing revenue at 20%, AWS at 37%, and advertising at 26% — while expanding operating margins — the multiple may be justified. The stock is up approximately 36% from its 52-week low of $196 but remains about 7% below its all-time high.
Wall Street Is Overwhelmingly Bullish
Analyst sentiment on Amazon is about as positive as it gets. According to MarketBeat, 59 Wall Street analysts cover the stock, with the consensus rating at "Moderate Buy." The breakdown is striking:
- Strong Buy / Buy: 96% (57 Buy, 1 Strong Buy)
- Hold: 3% (2 analysts)
- Sell / Underperform: 0%
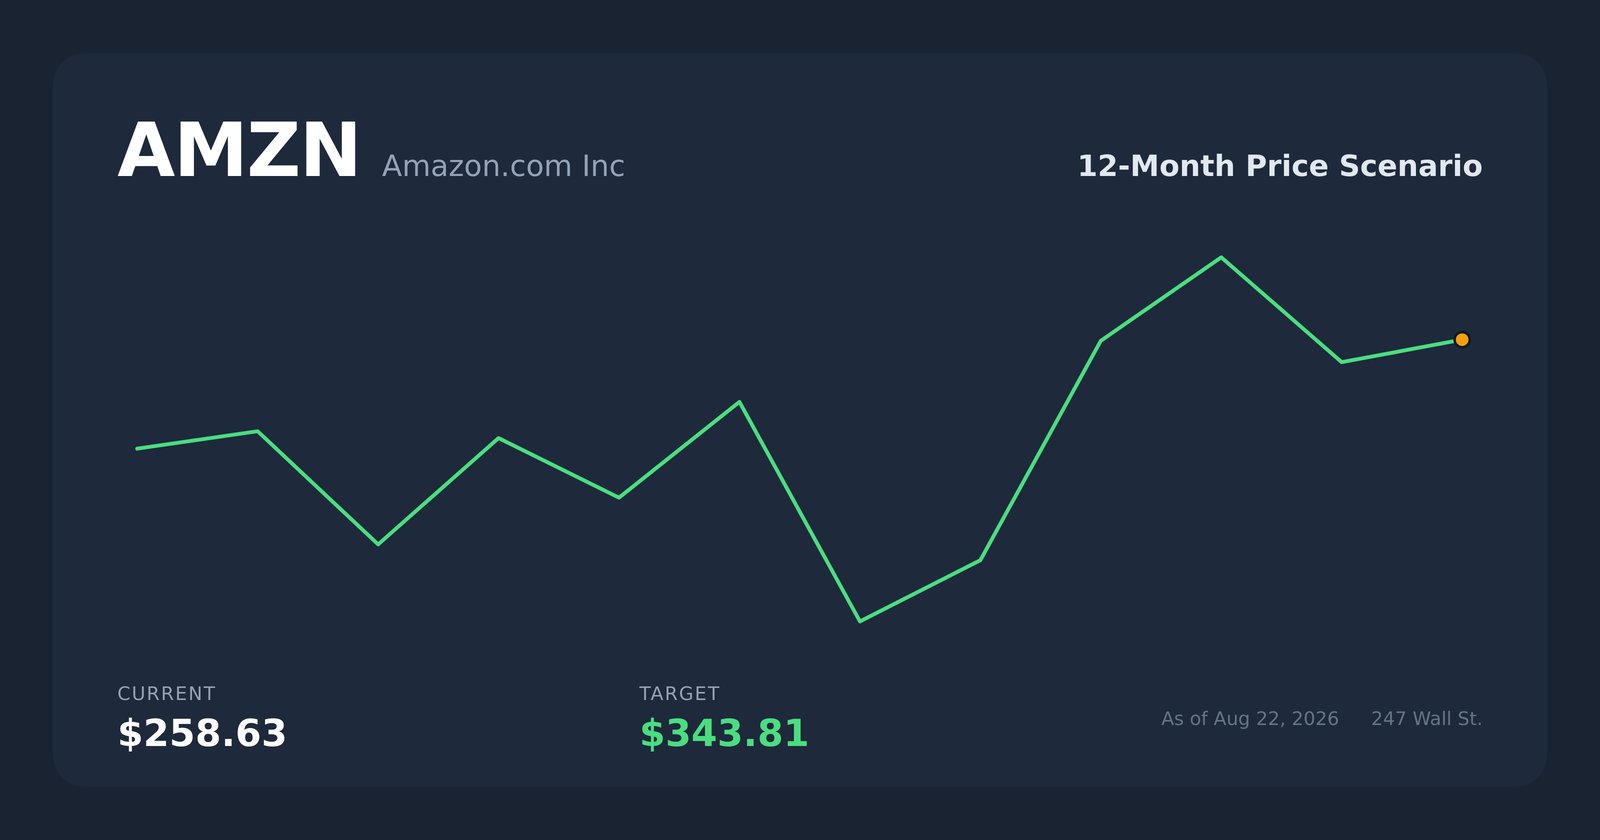
The average analyst price target ranges from $323 to $327, implying roughly 21-25% upside from current levels. The highest target on the Street is $405, while the lowest is $230. Zacks Investment Research maintains a Buy rating with an ABR of 1.17.
Evercore ISI tech analyst Mark Mahaney has called Amazon one of his "top picks" for 2026, citing reaccelerating AWS growth, demand for Trainium AI chips, strong advertising momentum, and the ramp of Alexa+. He believes the stock has roughly 50% upside potential over the next 12 months.
Technical Analysis: The Road Back to $287
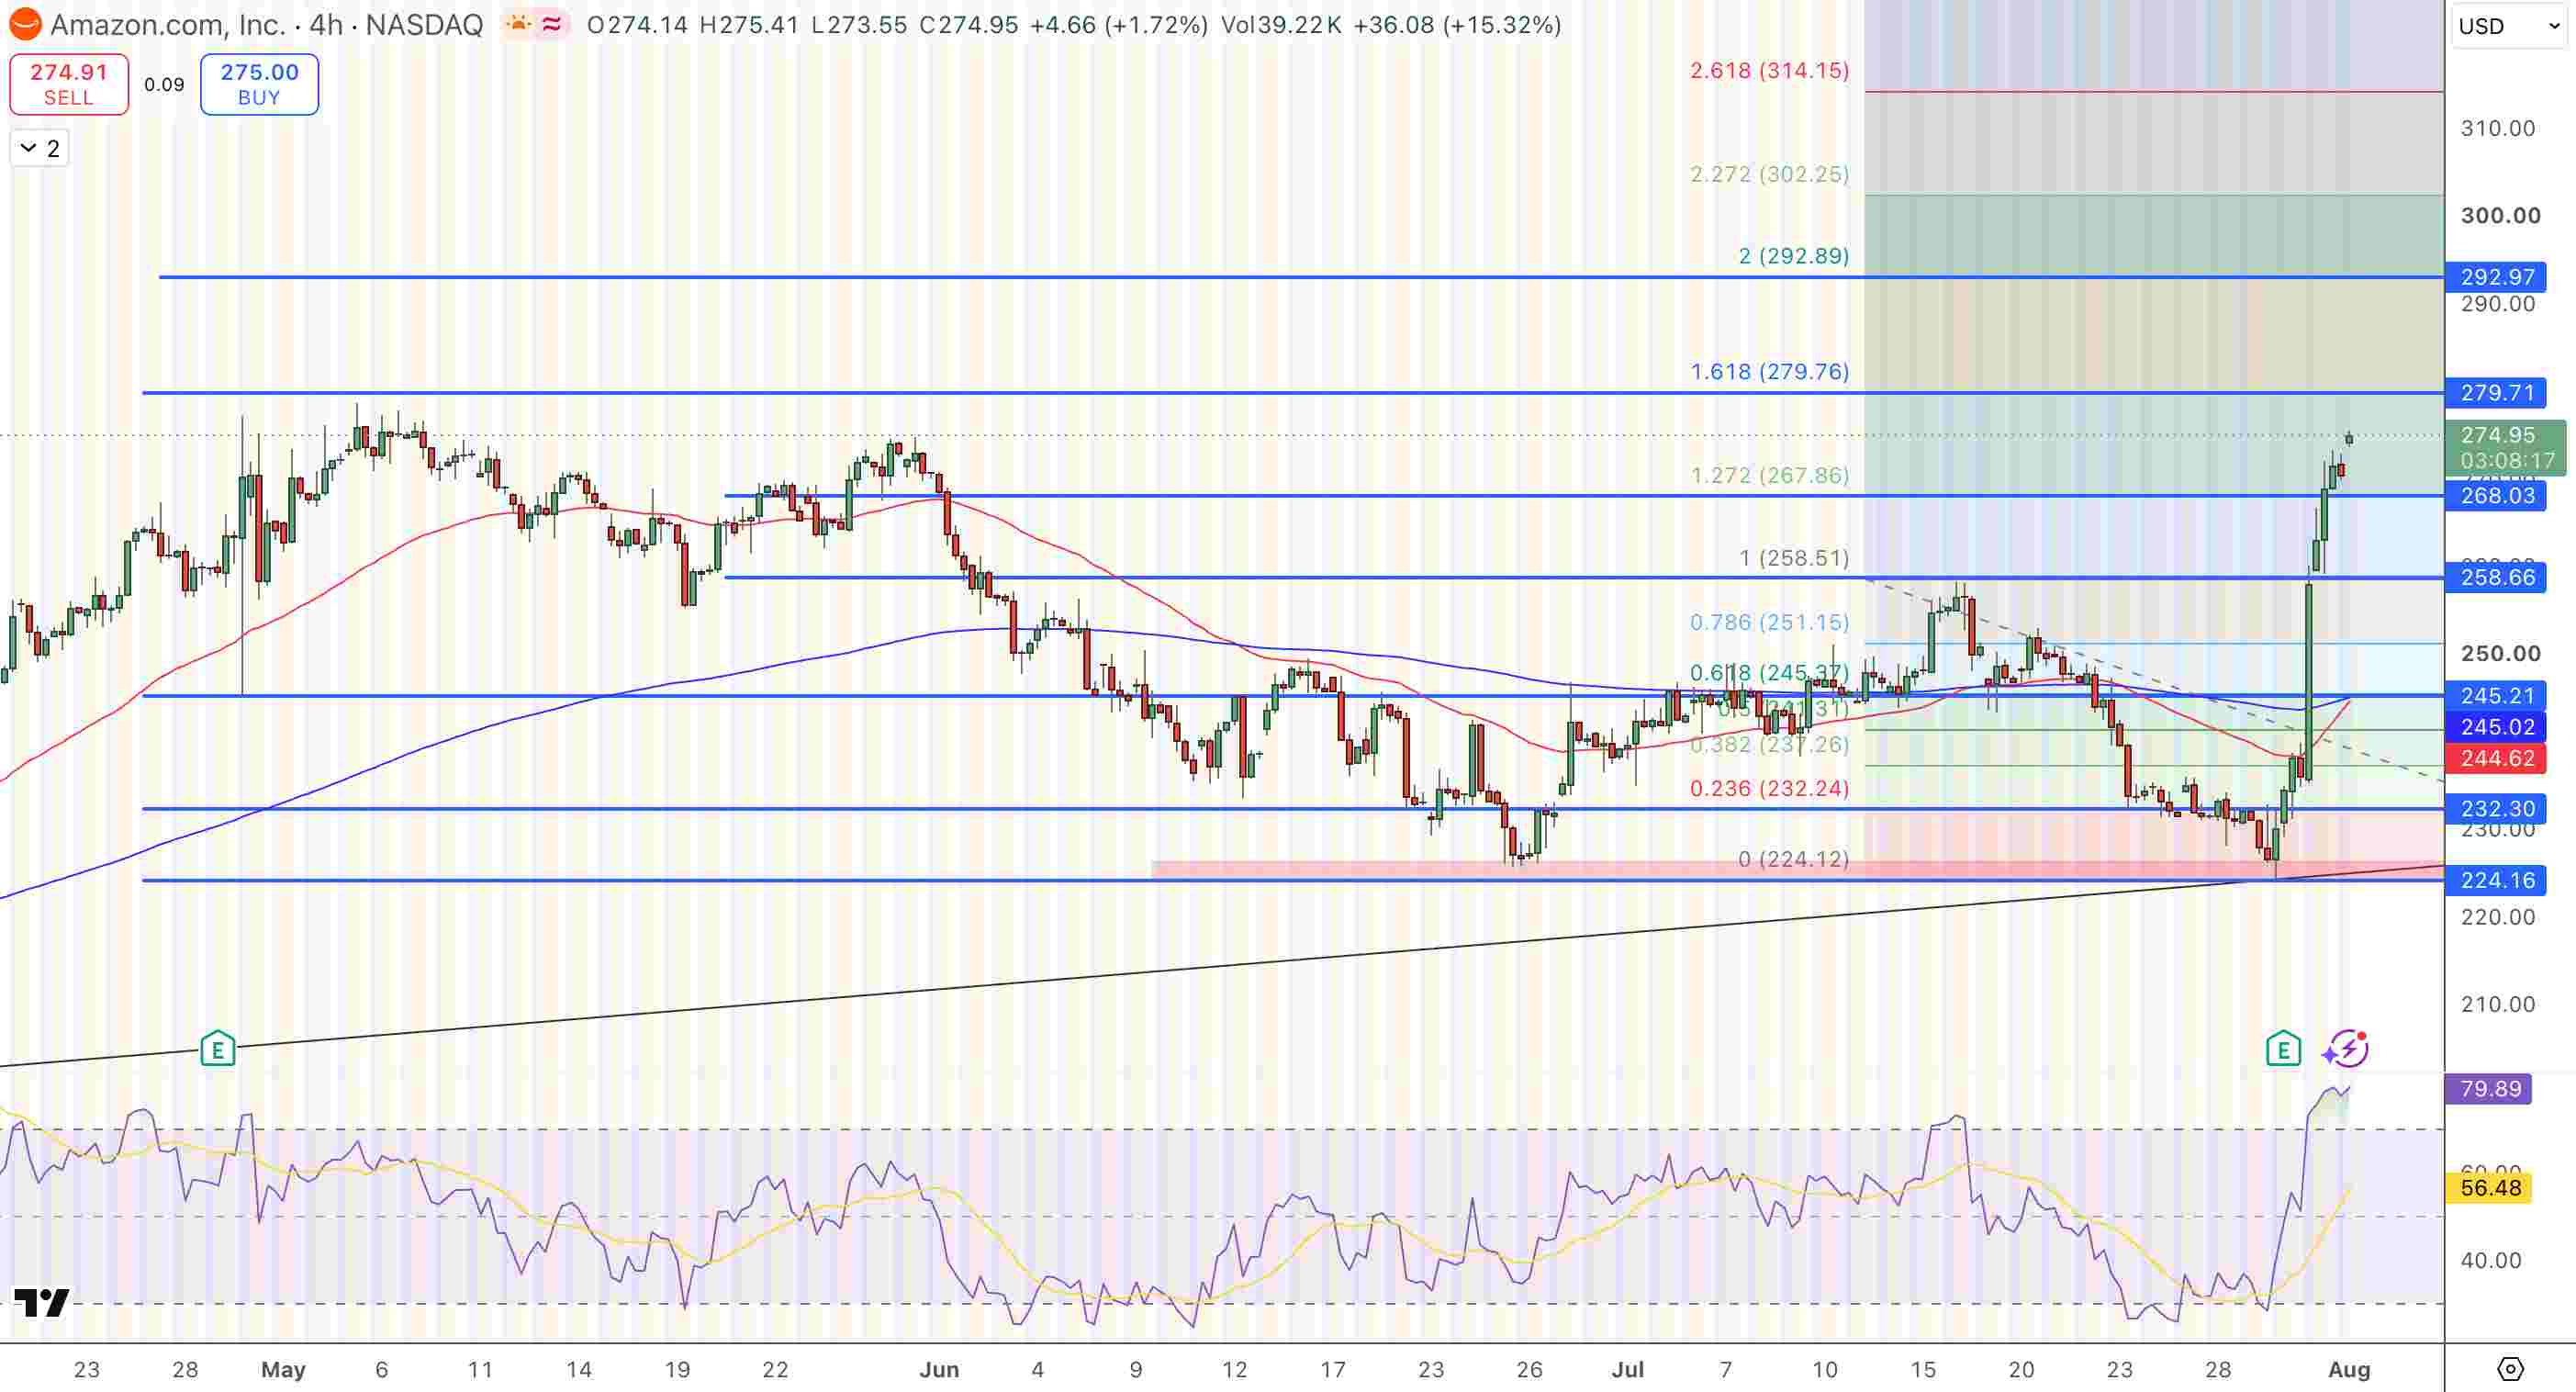
From a technical standpoint, Amazon stock is attempting to reclaim its uptrend after a brief pullback from the August 3 all-time high. The 15-minute chart shows AMZN building a series of higher lows, with the stock finding support at its rising 50-period EMA near $262. Key levels traders are watching:
- Immediate Resistance: $270 (psychological) and $275 (prior consolidation zone)
- Major Resistance: $287.20 (all-time high)
- Support: $260 (recent lows) and $255 (50-day moving average zone)
- Breakdown Risk: Below $250 could trigger selling toward $240
The MACD on the daily chart is showing early signs of a bullish crossover after the August decline, while volume on the August 28 rally was elevated at roughly 50 million shares — slightly above the 49 million average. That suggests institutional participation in the bounce. A breakout above $270 on strong volume would likely open the door for a retest of the all-time high.
The Risks Investors Cannot Ignore
No investment is without risk, and Amazon faces several legitimate challenges. Regulatory pressure is intensifying, with antitrust scrutiny on both sides of the Atlantic. The Federal Trade Commission's lawsuit against Amazon remains active, and European regulators continue to probe the company's marketplace practices.
Competition is also heating up. Microsoft Azure and Google Cloud are investing aggressively in AI infrastructure, and while AWS maintains a leadership position, market share battles could pressure pricing. In retail, Walmart, Temu, and Shein are all vying for consumer dollars, though Amazon's logistics advantage remains formidable.
The $200 billion CapEx commitment represents the biggest near-term risk. If AI demand fails to materialize as quickly as expected, or if returns on these massive infrastructure investments disappoint, Amazon's free cash flow could remain under pressure for years. The stock's 37x P/E leaves little room for error.
Finally, the Anthropic investment gain that inflated Q2 net income is non-recurring. Investors should focus on operating income and cash flow metrics rather than the headline EPS number when evaluating the underlying business.
Frequently Asked Questions
What is Amazon's stock price today?
As of August 28, 2026, Amazon (AMZN) closed at $266.43, up $10.17 (+3.97%). The 52-week range is $196.00 to $287.20.
What were Amazon's Q2 2026 earnings?
Amazon reported revenue of $200.6 billion (up 20%), operating income of $27.5 billion (up 43%), and diluted EPS of $5.75. AWS revenue grew 36.7% to $42.2 billion.
How big is AWS now?
AWS has an annualized revenue run rate of $169 billion and grew 36.7% in Q2 2026 — its fastest growth in 18 quarters. Operating margin reached 39.4%.
What is Amazon's AI revenue?
Amazon's AI revenue run rate is now over $25 billion, growing at triple-digit percentages year-over-year. Its custom chips business (Trainium/Graviton) also exceeds a $25 billion run rate.
Is Amazon stock a buy at $266?
96% of Wall Street analysts rate AMZN a Buy or Strong Buy, with 0% recommending Sell. The average price target is $323-$327, implying 21-25% upside. Evercore ISI sees 50% upside potential.
When is Amazon's next earnings report?
Amazon is expected to report Q3 2026 earnings in late October 2026. Management guided Q3 revenue of $197B-$202B and operating income of $22.5B-$26.5B.
Bottom Line for US Investors
Amazon at $266 is a study in contrasts. The stock is not cheap at 37x earnings, but the business is executing at a level that justifies a premium valuation. AWS is accelerating into the AI boom with a $169 billion run rate and $496 billion in contracted backlog. Advertising is growing at 26%. Prime Day just shattered records. And the company is building AI infrastructure that will define the next decade of technology.
For long-term American investors, the bull case is compelling. Amazon dominates three massive markets — cloud computing, e-commerce, and digital advertising — and is gaining ground in groceries, healthcare, and streaming. The $200 billion CapEx bet is enormous, but management has a track record of turning massive investments into dominant market positions.
The path to $300+ may not be linear. Regulatory risks, competition, and the sheer scale of capital spending create genuine uncertainty. But with 96% of analysts bullish, AWS reaccelerating, and AI revenue exploding past $25 billion, the odds appear to favor continued upside.
For investors with a multi-year time horizon, Amazon remains one of the most attractive large-cap growth stories in the US market.
Are you buying AMZN on this dip or waiting for a pullback below $250? Share your strategy in the comments below.
Topics: Amazon Stock AMZN, Amazon Stock Price Today, AMZN Stock Analysis, Amazon Earnings Q2 2026, AWS Revenue Growth, Amazon Prime Day 2026, Amazon AI Revenue, Andy Jassy, Cloud Stocks, Tech Stocks, NASDAQ AMZN, Investing


Comments
Post a Comment